Income-Producing Duplex | $3,000/Month in Rental Income Add a cash-flowing asset to your portfolio with 526 W Cambria St, an income-producing duplex generating $3,000 per month in rental income. With tenants already providing immediate income, this property offers investors the opportunity to step into an established revenue stream from day one. A new roof was installed in 2024, providing an important recent capital improvement and added peace of mind for the next owner. Whether you’re looking to expand an existing portfolio or make your first multifamily investment, this property offers a compelling combination of strong monthly income, multifamily utility, and recent improvements. $3,000/month in rental income. New roof. Two units. Immediate income potential. Schedule your showing and see what 526 W Cambria St can add to your portfolio.
For sale
$275,000
526 W Cambria St, Philadelphia, PA 19133
4beds
2baths
1,276sqft
Townhouse
Built in 1920
-- sqft lot
$-- Zestimate®
$216/sqft
$-- HOA
What's special
New roof
- 43 days
- 60
- 3
Zillow last checked:
Listing updated:
Listed by:
Rick Land 609-992-8248,
KW Empower 215-627-3500,
Listing Team: Ccl Team
Source: Bright MLS,MLS#: PAPH2674326
Facts & features
Interior
Bedrooms & bathrooms
- Bedrooms: 4
- Bathrooms: 2
Basement
- Area: 0
Heating
- Baseboard, Electric
Cooling
- None
Appliances
- Included: Electric Water Heater
- Laundry: Has Laundry
Features
- Basement: Unfinished
- Has fireplace: No
Interior area
- Total structure area: 1,276
- Total interior livable area: 1,276 sqft
Property
Parking
- Parking features: On Street
- Has uncovered spaces: Yes
Accessibility
- Accessibility features: None
Features
- Pool features: None
Lot
- Size: 714 Square Feet
Details
- Additional structures: Above Grade, Below Grade
- Parcel number: 192336000
- Zoning: RSA5
- Special conditions: Standard
Construction
Type & style
- Home type: MultiFamily
- Architectural style: Traditional
- Property subtype: Townhouse
Materials
- Masonry
- Foundation: Stone
Condition
- New construction: No
- Year built: 1920
Utilities & green energy
- Sewer: Public Sewer
- Water: Public
Community & HOA
Community
- Subdivision: North Central
Location
- Region: Philadelphia
- Municipality: PHILADELPHIA
Financial & listing details
- Price per square foot: $216/sqft
- Tax assessed value: $121,200
- Annual tax amount: $1,696
- Date on market: 9/25/2026
- Listing agreement: Exclusive Right To Sell
- Ownership: Fee Simple
- Total actual rent: 36000
- Income includes: Apartment Rentals
Estimated market value
Not available
Estimated sales range
Not available
Not available
Price history
| Date | Event | Price |
|---|---|---|
| 9/25/2026 | Listed for sale | $275,000+22.2%$216/sqft |
Source:  Bright MLS #PAPH2674326 Report a problem | ||
| 1/19/2025 | Listing removed | $225,000$176/sqft |
Source: Bright MLS #PAPH2377862 Report a problem | ||
| 7/18/2024 | Listed for sale | $225,000+662.7%$176/sqft |
Source: Bright MLS #PAPH2377862 Report a problem | ||
| 10/12/2018 | Sold | $29,500-20.3%$23/sqft |
Source: Public Record Report a problem | ||
| 6/23/2018 | Listed for sale | $37,000$29/sqft |
Source: Keller Williams Real Estate-Bl #1001926238 Report a problem | ||
| 1/1/2018 | Listing removed | $37,000$29/sqft |
Source: Kw Realty Center City #1000298909 Report a problem | ||
| 6/28/2017 | Price change | $37,000-4.9%$29/sqft |
Source: Keller Williams Realty Center City #6936751 Report a problem | ||
| 5/18/2017 | Price change | $38,900-9.3%$30/sqft |
Source: Keller Williams Realty Center City #6936751 Report a problem | ||
| 4/19/2017 | Price change | $42,900-12.3%$34/sqft |
Source: Keller Williams Realty Center City #6936751 Report a problem | ||
| 4/12/2017 | Price change | $48,900-9.4%$38/sqft |
Source: Keller Williams Realty Center City #6936751 Report a problem | ||
| 3/13/2017 | Price change | $54,000-6.1%$42/sqft |
Source: Keller Williams Realty Center City #6936751 Report a problem | ||
| 3/2/2017 | Listed for sale | $57,500$45/sqft |
Source: Keller Williams Realty Center City #6936751 Report a problem | ||
Public tax history
| Year | Property taxes | Tax assessment |
|---|---|---|
| 2025 | $1,748 +117.6% | $124,900 +117.6% |
| 2024 | $803 | $57,400 |
| 2023 | $803 +60.3% | $57,400 |
| 2022 | $501 | -- |
| 2021 | $501 -23.5% | -- |
| 2018 | $655 | -- |
| 2017 | $655 -16.1% | -- |
| 2016 | $781 +116.3% | -- |
| 2015 | $361 | -- |
| 2014 | $361 +4.5% | $55,800 +2542% |
| 2012 | $346 | $2,112 |
| 2011 | -- | $2,112 |
| 2010 | -- | $2,112 |
| 2009 | -- | $2,112 |
| 2008 | -- | $2,112 |
| 2007 | -- | $2,112 |
| 2006 | -- | $2,112 |
| 2005 | -- | $2,112 |
| 2004 | -- | $2,112 |
| 2003 | -- | $2,112 +26.9% |
| 2002 | -- | $1,664 +13% |
| 2000 | -- | $1,472 |
| 1999 | -- | $1,472 |
Find assessor info on the county website
Monthly payment
Est. payment
Payment breakdown
Explore the cost of this home by adjusting the details. Changes won't be saved.Climate risks
Neighborhood: Fairhill
Nearby schools
- $--1 bd1 ba600 sqft526 W Cambria St APT 1, Philadelphia, PA 19133Off Market

- $--3 bd1 ba1.1k sqft526 W Cambria St FLOOR 2, Philadelphia, PA 19133Off Market

- $110,900-- bd-- ba1k sqft524 W Cambria St, Philadelphia, PA 19133Off Market
- $160,000-- bd-- ba1k sqft528 W Cambria St, Philadelphia, PA 19133Off Market
Similar homes
- $239,9994 bd2 ba1.7k sqft2252 N Camac St, Philadelphia, PA 19133For Sale
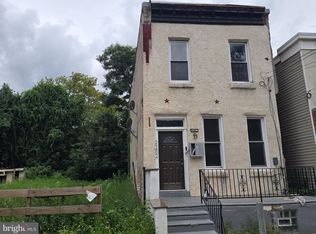
 MLS ID #PAPH2667212, Lubin Laventure, Realty Mark Associates. Bright MLS
- $319,0005 bd3 ba1.6k sqft1220 W Airdrie St, Philadelphia, PA 19140For Sale
 MLS ID #PAPH2681976, Stefan H Schecter, City & Suburban Real Estate. Bright MLS
- $249,0003 bd4 ba1.7k sqft1418 N 52nd St, Philadelphia, PA 19131For Sale
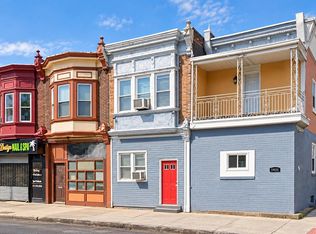 MLS ID #PAPH2679806, Katherine Mejia, Legal Real Estate LLC. Bright MLS
- $269,0003 bd1 ba1k sqft7203 Walker St, Philadelphia, PA 19135For Sale
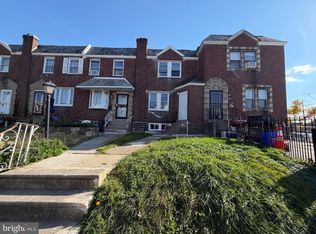 MLS ID #PAPH2687542, Kelly Huang, HK99 Realty LLC. Bright MLS
- $259,0003 bd1 ba1.3k sqft3183 Gaul St, Philadelphia, PA 19134For SaleMLS ID #PAPH2645814, Daniel Maneely, Liberty Bell Real Estate Brokerage LLC. Bright MLS
- $299,9004 bd3 ba1.3k sqft720 Winton St, Philadelphia, PA 19148For SaleMLS ID #PAPH2677336, Cindy Fan, Triamond Realty. Bright MLS
- $375,0004 bd4 ba1.6k sqft521 W Venango St, Philadelphia, PA 19140For SaleMLS ID #PAPH2683186, Phill Noeun, Canaan Realty Services INC. Bright MLS
- $200,0004 bd-- ba1.8k sqft3034 Frankford Ave, Philadelphia, PA 19134For SaleMLS ID #PAPH2642998, William Ndreu, Honest Real Estate. Bright MLS
- $245,0001 bd3 ba1.2k sqft200 E Albanus St, Philadelphia, PA 19120For SaleMLS ID #PAPH2669664, William Holder, Real of Pennsylvania. Bright MLS
- $193,5003 bd2 ba1.5k sqft2453 N Bouvier St, Philadelphia, PA 19132For SaleMLS ID #PAPH2685042, Mr. Keith Chennault Smith, Chennault Real Estate Inc. Bright MLS
- $310,0003 bd2 ba1k sqft435 E Wildey St, Philadelphia, PA 19125For SaleMLS ID #PAPH2648934, Arthur Dolan, Dolan Family Real Estate. Bright MLS
- $234,9005 bd2 ba1k sqft1239 N Allison St, Philadelphia, PA 19131For SaleMLS ID #PAPH2657658, Ayannah Fitzgerald, Domain Real Estate Group, LLC. Bright MLS
- $280,0003 bd1 ba1.1k sqft2606 Wharton St, Philadelphia, PA 19146For SaleMLS ID #PAPH2674360, Ms. Thanh Doan, Realty Mark Cityscape. Bright MLS
- $279,0004 bd2 ba1.1k sqft7529 Brentwood Rd, Philadelphia, PA 19151For SaleMLS ID #PAPH2653938, Zhongzhi Liu, Homelink Realty. Bright MLS
- $295,0002 bd-- ba1.3k sqft7736 Gilbert St, Philadelphia, PA 19150For SaleMLS ID #PAPH2677164, Toni Mangual-Stuard, Homestarr Realty. Bright MLS
- $310,0002 bd2 ba1.1k sqft1241 E Palmer St, Philadelphia, PA 19125For SaleMLS ID #PAPH2668592, Arthur Dolan, Dolan Family Real Estate. Bright MLS
- $299,9004 bd-- ba1.7k sqft7326 Ruskin Rd, Philadelphia, PA 19151For SaleMLS ID #PAPH2634478, Steven Osiecki, RE/MAX Access. Bright MLS
- $249,9003 bd2 ba1.2k sqft262 W Godfrey Ave, Philadelphia, PA 19120For SaleMLS ID #PAPH2652870, Jimmy Duong, Burholme Realty. Bright MLS
- $300,0004 bd2 ba1.2k sqft6137 Argyle St, Philadelphia, PA 19111For SaleMLS ID #PAPH2654656, JENNIFER J MADERA BONIFACIO, RE/MAX Select Group. Bright MLS
- $275,0003 bd2 ba1.6k sqft4243 Cottman Ave, Philadelphia, PA 19135For SaleMLS ID #PAPH2655242, Bryan Weng, 20/20 Real Estate - Bensalem. Bright MLS
