Welcome to 53 Ortoleva Drive, a charming 2-bed, 1-bath home in Providence’s desirable 02909! Full of character and brimming with potential, this property offers comfortable living space and a fantastic opportunity to make it your own. The basement is a blank canvas — finish it out for a family room, home office, or additional living area and add instant value. Ideally located close to local shops, dining, parks, and commuter routes, this home is perfect for first-time buyers and investors alike. Don’t miss out — schedule your private showing today!
Active
$325,000
53 Ortoleva Dr, Providence, RI 02909
2beds
1,320sqft
Single Family Residence
Built in 1940
3,049 Square Feet Lot
$-- Zestimate®
$246/sqft
$-- HOA
What's special
Comfortable living space
- 27 days
- 896
- 53
Zillow last checked:
Listing updated:
Listed by:
Lexi Moronta 401-451-2388,
Home Easy Homes
Source: StateWide MLS RI,MLS#: 1424239
Facts & features
Interior
Bedrooms & bathrooms
- Bedrooms: 2
- Bathrooms: 1
- Full bathrooms: 1
Bedroom 1
- Level: First
Bedroom 2
- Level: First
Kitchen
- Level: First
Living room
- Level: First
Heating
- Natural Gas, Forced Air
Cooling
- Wall Unit(s)
Appliances
- Included: Dryer, Range Hood, Washer, Electric Water Heater, Gas Water Heater
Features
- Wall (Dry Wall)
- Flooring: Hardwood, Laminate
- Doors: Storm Door(s)
- Basement: Full,Interior Entry,Unfinished,Storage Space,Utility
- Has fireplace: No
- Fireplace features: None
Interior area
- Total structure area: 660
- Total interior livable area: 1,320 sqft
- Finished area above ground: 660
- Finished area below ground: 660
Property
Parking
- Total spaces: 2
- Parking features: No Garage
Features
- Patio & porch: Patio, Porch
Lot
- Size: 3,049 Square Feet
Details
- Parcel number: PROVM95L379
Construction
Type & style
- Home type: SingleFamily
- Architectural style: Bungalow
- Property subtype: Single Family Residence
Materials
- Dry Wall, Aluminum Siding
- Foundation: Concrete Perimeter
Condition
- New construction: No
- Year built: 1940
Utilities & green energy
- Electric: 100 Amp Service
- Sewer: Public Sewer
- Water: Municipal
Community & HOA
HOA
- Has HOA: No
Location
- Region: Providence
Financial & listing details
- Price per square foot: $246/sqft
- Tax assessed value: $295,700
- Annual tax amount: $2,484
- Date on market: 9/24/2026
Estimated market value
Not available
Estimated sales range
Not available
$2,158/mo
Price history
| Date | Event | Price |
|---|---|---|
| 9/24/2026 | Listed for sale | $325,000-4.4%$246/sqft |
Source:  StateWide MLS RI #1424239 Report a problem | ||
| 9/21/2026 | Listing removed | $340,000$258/sqft |
Source: StateWide MLS RI #1422645 Report a problem | ||
| 9/8/2026 | Listed for sale | $340,000+7.3%$258/sqft |
Source: StateWide MLS RI #1422645 Report a problem | ||
| 12/5/2024 | Sold | $317,000+5.7%$240/sqft |
Source: StateWide MLS RI #1370260 Report a problem | ||
| 10/28/2024 | Pending sale | $299,900$227/sqft |
Source: StateWide MLS RI #1370260 Report a problem | ||
| 10/17/2024 | Listed for sale | $299,900+29.8%$227/sqft |
Source: StateWide MLS RI #1370260 Report a problem | ||
| 11/9/2021 | Sold | $231,000+5%$175/sqft |
Source: StateWide MLS RI #1294088 Report a problem | ||
| 10/19/2021 | Pending sale | $220,000$167/sqft |
Source: StateWide MLS RI #1294088 Report a problem | ||
| 9/28/2021 | Contingent | $220,000$167/sqft |
Source: StateWide MLS RI #1294088 Report a problem | ||
| 9/23/2021 | Listed for sale | $220,000+25.7%$167/sqft |
Source: StateWide MLS RI #1294088 Report a problem | ||
| 9/22/2020 | Sold | $175,000+3%$133/sqft |
Source: Public Record Report a problem | ||
| 5/31/2020 | Price change | $169,900-5.6%$129/sqft |
Source: The RI Real Estate Company #1251765 Report a problem | ||
| 5/17/2020 | Price change | $179,900-7.7%$136/sqft |
Source: The RI Real Estate Company #1251765 Report a problem | ||
| 5/11/2020 | Price change | $194,900-7.1%$148/sqft |
Source: The RI Real Estate Company #1251765 Report a problem | ||
| 4/16/2020 | Listed for sale | $209,900+95.3%$159/sqft |
Source: The RI Real Estate Company #1251765 Report a problem | ||
| 9/9/2019 | Sold | $107,500$81/sqft |
Source: Public Record Report a problem | ||
Public tax history
| Year | Property taxes | Tax assessment |
|---|---|---|
| 2025 | $2,484 -36.7% | $295,700 +38.2% |
| 2024 | $3,925 +3.1% | $213,900 |
| 2023 | $3,807 | $213,900 |
| 2022 | $3,807 +46.4% | $213,900 +102% |
| 2021 | $2,601 +0% | $105,900 |
| 2020 | $2,601 +66.6% | $105,900 |
| 2019 | $1,561 +24.9% | $105,900 +59.2% |
| 2018 | $1,250 -41.2% | $66,500 |
| 2017 | $2,125 | $66,500 |
| 2016 | $2,125 +13.5% | $66,500 +17.5% |
| 2015 | $1,873 -1.9% | $56,600 |
| 2013 | $1,910 -18.8% | $56,600 -23.3% |
| 2012 | $2,353 | $73,800 |
| 2011 | $2,353 +5% | $73,800 |
| 2010 | $2,242 -35.9% | $73,800 -48.9% |
| 2009 | $3,496 +6% | $144,400 |
| 2007 | $3,298 +15.7% | $144,400 +53.1% |
| 2006 | $2,851 | $94,300 |
| 2005 | $2,851 | $94,300 |
Find assessor info on the county website
Monthly payment
Est. payment
Payment breakdown
Explore the cost of this home by adjusting the details. Changes won't be saved.Climate risks
Neighborhood: Manton


Similar homes
- $350,0004 bd3 ba1.6k sqft31 Grosvenor Ave, Providence, RI 02908For Sale

 MLS ID #1418783, Roults Jean Francois, Real Broker, LLC. StateWide MLS RI
- $384,9002 bd2 ba1.1k sqft112 Hendrick St, Providence, RI 02908For Sale
 MLS ID #1421247, Mariana Freitas Novo, William Raveis Inspire. StateWide MLS RI
- $334,9002 bd2 ba1.2k sqftPinehurst, North Providence, RI 02904For Sale
 MLS ID #1426298, Anthony Barbieri, Great Move Realty. StateWide MLS RI
- $399,0002 bd1 ba1.1k sqft158 Ford St #160, Providence, RI 02909For Sale
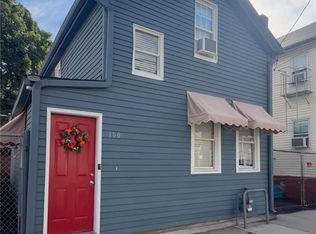 MLS ID #1421868, Ana Polanco, Real Broker, LLC. StateWide MLS RI
- $399,9003 bd2 ba1.7k sqft14 Yale Ave, Providence, RI 02908For SaleMLS ID #1425224, Rosa Dominguez, My Dream Home Realty. StateWide MLS RI
- $345,0003 bd2 ba1.3k sqft16 Winsor St, Providence, RI 02908For SaleMLS ID #1423020, Steve Eccleston, RI Real Estate Services. StateWide MLS RI
- $360,0004 bd2 ba1.1k sqft272 Veazie St, Providence, RI 02904For SaleMLS ID #1423227, Audrey Sanford, HFM Realty Inc.. StateWide MLS RI
- $325,0003 bd1 ba1.4k sqft88 Warrington St, Providence, RI 02907For SaleMLS ID #1419171, Deb Hackett, RE/MAX Town & Country. StateWide MLS RI
- $349,9003 bd2 ba1.6k sqft62 Legion Dr, Pawtucket, RI 02860For SaleMLS ID #1425321, Luis Mateus, Mateus Realty. StateWide MLS RI
- $475,0004 bd2 ba1.4k sqft32 Almy St, Providence, RI 02909For SaleMLS ID #1425630, David Sanabria, eXp Realty LLC. StateWide MLS RI
- $399,0004 bd1 ba1.5k sqft184 Cumberland St, Providence, RI 02908For SaleMLS ID #1425398, The Hiraldo Group, Innovations Realty. StateWide MLS RI
- $349,0004 bd2 ba1.4k sqft96 Birch St, Attleboro, MA 02703For SaleMLS ID #1425363, Shawnai Matos, Century 21 Signature Prop.. StateWide MLS RI
- $379,9003 bd1 ba1.1k sqft20 Lyman Ave, Johnston, RI 02919For SaleMLS ID #1424606, Wayne Hannon, LPT Realty. StateWide MLS RI
- $419,9003 bd2 ba1.3k sqft1022 Charles St, North Providence, RI 02904For SaleMLS ID #1426241, Beatriz Giron, Coldwell Banker Realty. StateWide MLS RI
- $323,9002 bd1 ba971 sqft76 Dickens St, Attleboro, MA 02703For SaleMLS ID #1417269, Tara Brady, O'Malley-Brady Realty, Inc.. StateWide MLS RI
- $290,0002 bd1 ba1.6k sqft23 Whitford Ave, Pawtucket, RI 02860For SaleMLS ID #1423337, Kevin Dumont, Better Living Real Estate, LLC. StateWide MLS RI
- $329,9003 bd1 ba1.4k sqft46 Sweet St, Warwick, RI 02889For SaleMLS ID #1423621, Chris Stephenson, RI Real Estate Services. StateWide MLS RI
- $299,0002 bd1 ba1k sqft23 Harmony Ct, Warwick, RI 02889For SaleMLS ID #1424800, Elvis Santana, Circle 100 Real Estate. StateWide MLS RI
- $320,0002 bd2 ba995 sqftLa Strada Condominiums, Johnston, RI 02919For SaleMLS ID #1423567, Richard Baccari, Churchill & Banks Co., LLC. StateWide MLS RI
- $370,0003 bd1 ba1k sqft48 Ash St, Pawtucket, RI 02860For SaleMLS ID #1425129, Mike Messier, eXp Realty. StateWide MLS RI
