Move in and enjoy! Complete renovation! 3 bedroom, 2 bathroom home in a great location on the south side of town. Over 1400 sq ft on the main level with a full basement for extra space. Tastefully updated throughout. Large kitchen with pantry and new appliances. Master bedroom with ensuite bath. Covered front porch. Rear patio with privacy fence. This is a must see. Call an agent to schedule a showing today.
Active
Price cut: $6K (10/12)
$188,000
533 Chester Ave, Ottumwa, IA 52501
3beds
1,476sqft
Single Family Residence
Built in 1900
6,098 Square Feet Lot
$-- Zestimate®
$127/sqft
$-- HOA
What's special
Tastefully updated throughoutComplete renovationCovered front porchLarge kitchen with pantryNew appliances
- 32 days
- 425
- 27
Zillow last checked:
Listing updated:
Listed by:
Anthony J Gevock 641-919-1784,
RE/MAX Pride Ottumwa
Source: NoCoast MLS as distributed by MLS GRID,MLS#: 6342885
Facts & features
Interior
Bedrooms & bathrooms
- Bedrooms: 3
- Bathrooms: 2
- Full bathrooms: 2
Heating
- Forced Air
Cooling
- Central Air
Features
- Basement: Full
Interior area
- Total interior livable area: 1,476 sqft
Property
Parking
- Total spaces: 1
- Parking features: Garage
- Garage spaces: 1
Accessibility
- Accessibility features: None
Lot
- Size: 6,098 Square Feet
- Dimensions: 46 x 132
Details
- Parcel number: 007416350001000
Construction
Type & style
- Home type: SingleFamily
- Architectural style: Ranch
- Property subtype: Single Family Residence
Materials
- Vinyl Siding
Condition
- Year built: 1900
Utilities & green energy
- Sewer: Public Sewer
- Water: Public
Community & HOA
Community
- Subdivision: EVANS & ROOTS ADD
HOA
- Has HOA: No
Location
- Region: Ottumwa
Financial & listing details
- Price per square foot: $127/sqft
- Tax assessed value: $96,590
- Annual tax amount: $1,696
- Date on market: 9/19/2026
- Cumulative days on market: 33 days
Estimated market value
Not available
Estimated sales range
Not available
Not available
Price history
| Date | Event | Price |
|---|---|---|
| 10/12/2026 | Price change | $188,000-3.1%$127/sqft |
Source:  NoCoast MLS as distributed by MLS GRID #6342885 Report a problem | ||
| 9/19/2026 | Listed for sale | $194,000+68.7%$131/sqft |
Source: NoCoast MLS as distributed by MLS GRID #6342885 Report a problem | ||
| 7/18/2024 | Sold | $115,000-10.2%$78/sqft |
Source: NoCoast MLS as distributed by MLS GRID #6316416 Report a problem | ||
| 6/7/2024 | Pending sale | $128,000$87/sqft |
Source: NoCoast MLS as distributed by MLS GRID #6316416 Report a problem | ||
| 5/3/2024 | Price change | $128,000-7.2%$87/sqft |
Source: NoCoast MLS as distributed by MLS GRID #6316416 Report a problem | ||
| 4/16/2024 | Listed for sale | $138,000+38%$93/sqft |
Source: NoCoast MLS as distributed by MLS GRID #6316416 Report a problem | ||
| 6/3/2021 | Sold | $100,000-8.7%$68/sqft |
Source: NoCoast MLS as distributed by MLS GRID #5698336 Report a problem | ||
| 1/14/2021 | Listing removed | -- |
Source: NoCoast MLS as distributed by MLS GRID Report a problem | ||
| 1/5/2021 | Listed for sale | $109,500+11.7%$74/sqft |
Source: Julian Campbell Realtors #5698336 Report a problem | ||
| 7/3/2020 | Sold | $98,000-0.5%$66/sqft |
Source: NoCoast MLS as distributed by MLS GRID #5561350 Report a problem | ||
| 5/27/2020 | Pending sale | $98,500$67/sqft |
Source: Bridge City Realty #5561350 Report a problem | ||
| 5/7/2020 | Listed for sale | $98,500$67/sqft |
Source: Bridge City Realty #5561350 Report a problem | ||
Public tax history
| Year | Property taxes | Tax assessment |
|---|---|---|
| 2025 | $1,696 +5.7% | $96,590 +9.3% |
| 2024 | $1,604 +10.6% | $88,400 |
| 2023 | $1,450 +1.1% | $88,400 +27% |
| 2022 | $1,434 +9% | $69,590 +0.3% |
| 2021 | $1,316 -1.2% | $69,400 +34.1% |
| 2020 | $1,332 -2.1% | $51,770 |
| 2019 | $1,360 -8% | $51,770 |
| 2018 | $1,478 +12% | $51,770 -9% |
| 2017 | $1,320 -8.8% | $56,890 -1.8% |
| 2016 | $1,448 -0.1% | $57,951 |
| 2015 | $1,450 | $57,951 |
| 2014 | $1,450 +6.3% | $57,951 |
| 2013 | $1,364 +3.3% | -- |
| 2012 | $1,320 +3.8% | -- |
| 2011 | $1,272 +1.8% | -- |
| 2010 | $1,250 +7% | -- |
| 2009 | $1,168 +3.4% | -- |
| 2008 | $1,130 +4.1% | -- |
| 2007 | $1,086 +32.4% | -- |
| 2005 | $820 | -- |
Find assessor info on the county website
Monthly payment
Est. payment
Payment breakdown
Explore the cost of this home by adjusting the details. Changes won't be saved.Climate risks
Neighborhood: 52501


Similar homes
- $190,0003 bd2 ba1.3k sqft1304 Chester Ave, Ottumwa, IA 52501Active
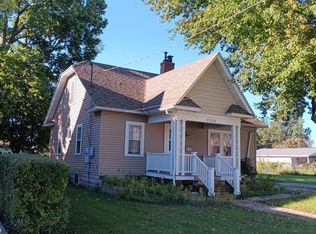 MLS ID #6343327, Lonnie D Lunsford, Team Real Estate. NoCoast MLS as distributed by MLS GRID
- $199,0003 bd3 ba1.5k sqft1580 N Van Buren Ave, Ottumwa, IA 52501Active
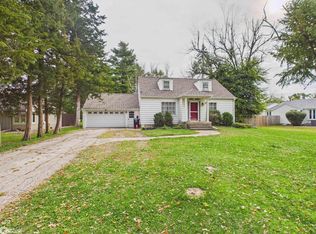 MLS ID #6343706, Anthony J Gevock, RE/MAX Pride Ottumwa. NoCoast MLS as distributed by MLS GRID
- $157,9003 bd3 ba2k sqft505 Chester Ave, Ottumwa, IA 52501Active
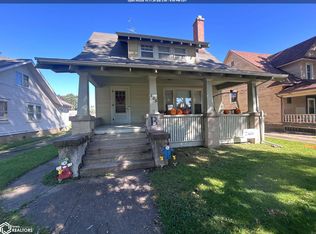 MLS ID #6343418, Kayla Miller, Bogle Realty LLC. NoCoast MLS as distributed by MLS GRID
- $169,9003 bd2 ba1.1k sqft315 Osceola St, Ottumwa, IA 52501Active
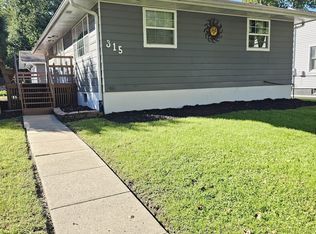 MLS ID #6341907, Pablo Zavala, Uplift Realty. NoCoast MLS as distributed by MLS GRID
