$9,450
3,150 Square Feet
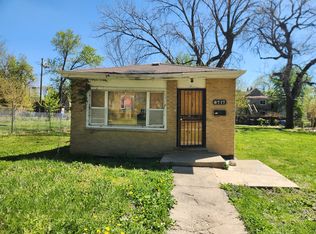
5334 S Union Ave, Chicago, IL 60609
Off Market
Zillow last checked:
Listing updated:
Nadia Meza 773-717-5364,
Classic Realty Group Prestige,
Alma Meza,
Classic Realty Group Prestige
Not available
Estimated sales range
Not available
Not available
| Date | Event | Price |
|---|---|---|
| 11/14/2025 | Listed for sale | $65,000+226.6%$35/sqft |
Source: | ||
| 10/2/2018 | Listing removed | $19,900$11/sqft |
Source: 606 Brokers LLC #09824769 Report a problem | ||
| 1/19/2018 | Pending sale | $19,900$11/sqft |
Source: 606 Brokers LLC #09824769 Report a problem | ||
| 1/3/2018 | Listed for sale | $19,900$11/sqft |
Source: 606 Brokers LLC #09824769 Report a problem | ||
| 8/14/2017 | Listing removed | $19,900$11/sqft |
Source: Keller Williams Preferred Realty #09354262 Report a problem | ||
| 2/15/2017 | Price change | $19,900+53.1%$11/sqft |
Source: Keller Williams - Keller Williams Preferred Realty #09354262 Report a problem | ||
| 2/13/2017 | Listed for sale | $13,000$7/sqft |
Source: Keller Williams - Keller Williams Preferred Realty #09354262 Report a problem | ||
| 1/9/2017 | Pending sale | $13,000$7/sqft |
Source: Keller Williams - Keller Williams Preferred Realty #09354262 Report a problem | ||
| 11/2/2016 | Price change | $13,000-13.3%$7/sqft |
Source: Keller Williams - Keller Williams Preferred Realty #09354262 Report a problem | ||
| 10/10/2016 | Listed for sale | $15,000$8/sqft |
Source: Keller Williams - Keller Williams Preferred Realty #09354262 Report a problem | ||
| Year | Property taxes | Tax assessment |
|---|---|---|
| 2024 | -- | $9,000 +125.1% |
| 2023 | $844 +2.6% | $3,999 |
| 2022 | $823 +2.3% | $3,999 |
| 2021 | $804 -73.4% | $3,999 -70.6% |
| 2020 | $3,026 -0.2% | $13,585 -10% |
| 2019 | $3,033 +1.7% | $15,095 |
| 2018 | $2,982 +37.6% | $15,095 +49.9% |
| 2017 | $2,167 +7.5% | $10,068 |
| 2016 | $2,017 +9.3% | $10,068 |
| 2015 | $1,845 +16.2% | $10,068 +17.6% |
| 2014 | $1,588 +2% | $8,559 |
| 2013 | $1,557 +1.4% | $8,559 |
| 2012 | $1,536 +9.9% | $8,559 -0.8% |
| 2011 | $1,397 -0.4% | $8,624 |
| 2010 | $1,403 +4.4% | $8,624 |
| 2009 | $1,345 -1.6% | $8,624 -9.4% |
| 2008 | $1,366 +1% | $9,524 |
| 2007 | $1,353 -12.8% | $9,524 -11.8% |
| 2006 | $1,551 +125% | $10,802 +156.2% |
| 2005 | $689 +1% | $4,217 |
| 2004 | $682 -14% | $4,217 -15.9% |
| 2003 | $793 +56.3% | $5,014 +77.4% |
| 2002 | $508 +3.7% | $2,826 |
| 2001 | $489 +33.3% | $2,826 |
| 2000 | $367 +0% | $2,826 +47.9% |
| 1999 | $367 | $1,911 |
Find assessor info on the county website
Source: MRED as distributed by MLS GRID. This data may not be complete. We recommend contacting the local school district to confirm school assignments for this home.
A local agent can set up tours, give advice and negotiate with sellers.
A local lender can help you make sure your offer is ready when you are.