Welcome to 5422 35th Street! This 4-bedroom, 2-bathroom home offers a versatile layout with room to make it your own. The additional bedrooms provide options for a home office, hobby room, or guest space. Conveniently located near shopping, dining, and parks, this property is worth a look whether you're searching for your next home or an investment opportunity. Schedule your showing today!
For sale
Price cut: $4K (11/9)
$145,000
5422 35th St, Lubbock, TX 79407
4beds
1,461sqft
Single Family Residence, Residential
Built in 1963
6,969 Square Feet Lot
$142,100 Zestimate®
$99/sqft
$-- HOA
What's special
Versatile layout
- 19 days
- 274
- 41
Likely to sell faster than
Zillow last checked:
Listing updated:
Listed by:
Madison Sutherland TREC #0853397 806-445-7795,
Sutherland, REALTORS,
Jordan Sutherland TREC #0685780 806-773-1929,
Sutherland, REALTORS
Source: LBMLS,MLS#: 202614674
Facts & features
Interior
Bedrooms & bathrooms
- Bedrooms: 4
- Bathrooms: 2
- Full bathrooms: 2
Heating
- Central, Natural Gas
Cooling
- Central Air, Electric
Features
- Ceiling Fan(s), Pantry, Walk-In Closet(s)
- Has fireplace: No
Interior area
- Total structure area: 1,461
- Total interior livable area: 1,461 sqft
- Finished area above ground: 1,461
Property
Parking
- Parking features: Off Street
Features
- Exterior features: Private Yard
- Fencing: Back Yard
Lot
- Size: 6,969 Square Feet
Details
- Parcel number: R123510
Construction
Type & style
- Home type: SingleFamily
- Property subtype: Single Family Residence, Residential
Materials
- Brick, Wood Siding
- Foundation: Slab
- Roof: Composition
Condition
- New construction: No
- Year built: 1963
Community & HOA
Community
- Security: None
Location
- Region: Lubbock
Financial & listing details
- Price per square foot: $99/sqft
- Tax assessed value: $153,958
- Annual tax amount: $2,896
- Date on market: 10/28/2026
- Cumulative days on market: 21 days
- Listing terms: Cash,Conventional
- Road surface type: Asphalt
Estimated market value
$142,100
$135,000 - $149,000
$1,504/mo
Price history
| Date | Event | Price |
|---|---|---|
| 11/9/2026 | Price change | $145,000-2.7%$99/sqft |
Source:  LBMLS #202614674 Report a problem | ||
| 10/28/2026 | Listed for sale | $149,000+56.8%$102/sqft |
Source: LBMLS #202614674 Report a problem | ||
| 10/26/2026 | Listing removed | $1,350$1/sqft |
Source: Zillow Rentals Report a problem | ||
| 8/31/2026 | Price change | $1,350-3.6%$1/sqft |
Source: Zillow Rentals Report a problem | ||
| 8/21/2026 | Price change | $1,400-6.7%$1/sqft |
Source: Zillow Rentals Report a problem | ||
| 8/4/2026 | Listed for rent | $1,500+15.8%$1/sqft |
Source: Zillow Rentals Report a problem | ||
| 8/23/2023 | Listing removed | -- |
Source: Zillow Rentals Report a problem | ||
| 8/15/2023 | Price change | $1,295-4.1%$1/sqft |
Source: Zillow Rentals Report a problem | ||
| 7/14/2023 | Listed for rent | $1,350+28.6%$1/sqft |
Source: Zillow Rentals Report a problem | ||
| 7/2/2020 | Listing removed | $95,000$65/sqft |
Source: Coldwell Banker Trusted Adviso #202004302 Report a problem | ||
| 11/15/2019 | Listed for sale | $95,000+26.7%$65/sqft |
Source: Coldwell Banker Rick Canup, Realtors #201909994 Report a problem | ||
| 12/3/2018 | Listing removed | $1,050$1/sqft |
Source: Coldwell Banker Residential Property Management Report a problem | ||
| 10/16/2018 | Listed for rent | $1,050$1/sqft |
Source: Coldwell Banker Residential Property Management Report a problem | ||
| 12/30/2017 | Listing removed | $75,000$51/sqft |
Source: Lubbock Real Estate Group #201708696 Report a problem | ||
| 12/9/2017 | Price change | $75,000-2.6%$51/sqft |
Source: Lubbock Real Estate Group #201708696 Report a problem | ||
| 11/27/2017 | Price change | $77,000-11.5%$53/sqft |
Source: Lubbock Real Estate Group #201708696 Report a problem | ||
| 11/14/2017 | Listed for sale | $87,000$60/sqft |
Source: Lubbock Real Estate Group #201708696 Report a problem | ||
Public tax history
| Year | Property taxes | Tax assessment |
|---|---|---|
| 2026 | -- | $153,958 -5.9% |
| 2025 | $2,896 +5.2% | $163,666 +7.9% |
| 2024 | $2,753 +14.6% | $151,625 +17.3% |
| 2023 | $2,403 -8.2% | $129,283 |
| 2022 | $2,617 +31% | $129,283 +37.6% |
| 2021 | $1,998 +15.2% | $93,923 +16% |
| 2020 | $1,735 -1.5% | $80,994 |
| 2019 | $1,761 +275.5% | $80,994 -5.4% |
| 2018 | $469 | $85,635 +10% |
| 2017 | $469 -19.9% | $77,850 +3.5% |
| 2016 | $586 | $75,211 +10% |
| 2015 | $586 | $68,374 |
| 2014 | $586 | $68,374 |
| 2013 | -- | $68,374 |
| 2012 | -- | $68,374 |
| 2011 | -- | $68,374 +0.3% |
| 2010 | -- | $68,185 +10% |
| 2009 | -- | $61,986 +10% |
| 2008 | -- | $56,351 +10% |
| 2007 | -- | $51,228 |
| 2006 | -- | $51,228 |
| 2005 | -- | $51,228 +12.2% |
| 2004 | -- | $45,650 |
| 2003 | -- | $45,650 -3.6% |
| 2002 | $538 -10.2% | $47,361 +7.4% |
| 2001 | $599 +19.8% | $44,093 +12.2% |
| 2000 | $500 | $39,295 |
Find assessor info on the county website
Monthly payment
Est. payment
Payment breakdown
Explore the cost of this home by adjusting the details. Changes won't be saved.Climate risks
Neighborhood: Bowie

Similar homes
- $--3 bd2 ba1.7k sqft5415 33rd St, Lubbock, TX 79407Auction
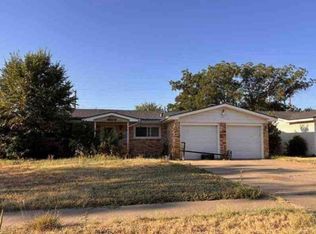 Xome
- $150,0003 bd2 ba1.2k sqft5427 34th St, Lubbock, TX 79407For Sale
 MLS ID #202614391, Dianna L Romans, Keller Williams Realty. LBMLS
- $169,0003 bd2 ba1.2k sqft5325 32nd St, Lubbock, TX 79407For Sale
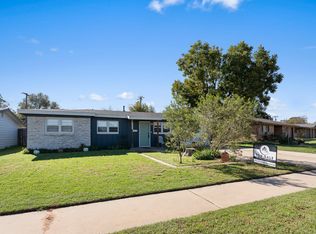 MLS ID #202615141, Katie Jo Schafer, Keller Williams Realty. LBMLS
- $140,0003 bd3 ba1.3k sqft5759 38th St, Lubbock, TX 79407For Sale
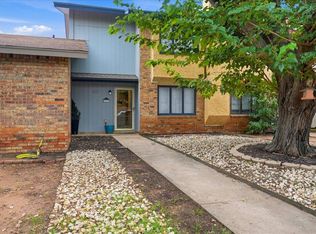 MLS ID #202614681, Denisha Schmucker, Keller Williams Realty. LBMLS
