This 2075 square foot single family home has 3 bedrooms and 2.0 bathrooms. This home is located at 5439 Sawgrass Rd, Sarasota, FL 34232.
Pre-foreclosure
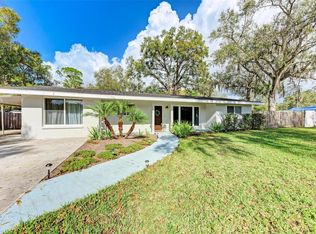
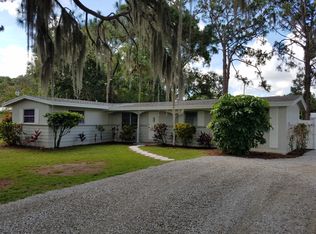
Street View
Est. $246,300
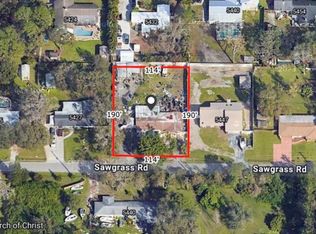
5439 Sawgrass Rd, Sarasota, FL 34232
3beds
2baths
2,075sqft
SingleFamily
Built in 1969
0.5 Acres Lot
$-- Zestimate®
$119/sqft
$-- HOA
Overview
- 25 days |
- 70 |
- 1 |
Facts & features
Interior
Bedrooms & bathrooms
- Bedrooms: 3
- Bathrooms: 2
Heating
- Other
Features
- Flooring: Other, Carpet
Interior area
- Total interior livable area: 2,075 sqft
Property
Parking
- Parking features: Carport
Features
- Exterior features: Stucco
Lot
- Size: 0.5 Acres
Details
- Parcel number: 0047120037
Construction
Type & style
- Home type: SingleFamily
Materials
- masonry
- Foundation: Concrete
- Roof: Asphalt
Condition
- Year built: 1969
Community & HOA
Location
- Region: Sarasota
Financial & listing details
- Price per square foot: $119/sqft
- Tax assessed value: $246,300
- Annual tax amount: $770
Visit our professional directory to find a foreclosure specialist in your area that can help with your home search.
Find a foreclosure agentForeclosure details
Estimated market value
Not available
Estimated sales range
Not available
$3,412/mo
Price history
| Date | Event | Price |
|---|---|---|
| 3/11/1994 | Sold | $90,000+28.6%$43/sqft |
Source: Public Record Report a problem | ||
| 1/5/1994 | Sold | $70,000$34/sqft |
Source: Public Record Report a problem | ||
Public tax history
| Year | Property taxes | Tax assessment |
|---|---|---|
| 2025 | $770 +7% | $152,539 +2.9% |
| 2024 | $720 +12.5% | $148,240 +3% |
| 2023 | $639 +8.9% | $143,922 +3% |
| 2022 | $587 -2.4% | $139,730 +3% |
| 2021 | $602 +3.5% | $135,660 +1.4% |
| 2020 | $581 +6.6% | $133,787 +2.3% |
| 2019 | $545 | $130,779 +1.9% |
| 2018 | $545 +5.7% | $128,341 +2.1% |
| 2017 | $516 -5.6% | $125,701 -28.9% |
| 2016 | $547 | $176,700 +9.1% |
| 2015 | $547 | $162,000 +35.6% |
| 2014 | $547 | $119,498 |
| 2013 | $547 | $119,498 +1.7% |
| 2012 | $547 | $117,500 -5.8% |
| 2011 | $547 +4% | $124,800 +2.5% |
| 2010 | $525 -10.6% | $121,770 +10% |
| 2009 | $588 | $110,700 -34.1% |
| 2008 | $588 -0.2% | $168,100 -0.9% |
| 2007 | $589 | $169,700 -21.9% |
| 2006 | -- | $217,200 +29.5% |
| 2005 | -- | $167,700 +31% |
| 2004 | $525 -62.4% | $128,000 +55.3% |
| 2003 | $1,396 -1.3% | $82,421 +2.4% |
| 2002 | $1,414 +6.2% | $80,489 +1.6% |
| 2001 | $1,331 +1.6% | $79,221 +3% |
| 2000 | $1,310 | $76,914 |
Find assessor info on the county website
Monthly payment
Estimated monthly payment$1,822
All calculations are estimates and provided by Zillow, Inc. for informational purposes only. Actual amounts may vary.
HOA fees may include property taxes on listings classified as Co-Ops. Contact the listing agent and/or owner for fee details.
Mortgage interest rates are dependent on a number of factors, including credit score, down payment, and repayment length. Interest rate data provided by Zillow Group Marketplace, Inc. as of 1/1/1970 from various mortgage lenders with which we have lead or other similar arrangements; the Estimated Payment is an average of those rates.
See how much you could borrow to make a competitive offer.
Climate risks
Neighborhood: Fruitville
Nearby schools
GreatSchools rating
- 7/10Fruitville Elementary SchoolGrades: PK-5Distance: 0.2 mi
- 5/10Mcintosh Middle SchoolGrades: 6-8Distance: 0.7 mi
- 5/10Sarasota High SchoolGrades: 9-12Distance: 4.1 mi


- Florida
- Sarasota County
- Sarasota
- 34232
- Fruitville
- 5439 Sawgrass Rd
Nearby cities
Nearby neighborhoods
Nearby zip codes
Other Sarasota Topics
