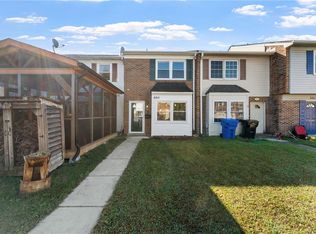
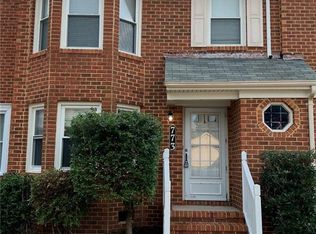
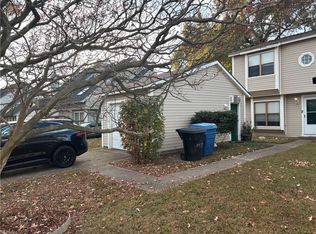
$251,000
2 bd2 ba1.1k sqft
5526 New Colony Dr, Virginia Beach, VA 23464
Off Market
Zillow last checked:
Listing updated:
Bobby Brown 240-210-3398,
Five Star Real Estate 240-222-3200

$254,000
$241,000 - $267,000
$2,101/mo
| Date | Event | Price |
|---|---|---|
| 10/31/2026 | Price change | $254,000-1.9%$200/sqft |
Source:  Bright MLS #VAVB2000750 Report a problem | ||
| 10/26/2026 | Listed for sale | $259,000+103.9%$204/sqft |
Source: Bright MLS #VAVB2000750 Report a problem | ||
| 5/8/2017 | Sold | $127,000-2.2%$100/sqft |
Source: Public Record Report a problem | ||
| 3/28/2017 | Price change | $129,900-8.5%$102/sqft |
Source: Lonnie Bush Real Estate LLC #10117355 Report a problem | ||
| 2/16/2017 | Price change | $142,000-4.7%$112/sqft |
Source: The Real Estate Group #1647219 Report a problem | ||
| 10/25/2016 | Price change | $149,000-3.9%$117/sqft |
Source: The Real Estate Group #1647219 Report a problem | ||
| 9/28/2016 | Listed for sale | $155,000-2.7%$122/sqft |
Source: The Real Estate Group #1647219 Report a problem | ||
| 2/26/2016 | Sold | $159,313+0.8%$125/sqft |
Source: Public Record Report a problem | ||
| 10/30/2006 | Sold | $158,000+107.9%$124/sqft |
Source: Public Record Report a problem | ||
| 6/21/2002 | Sold | $76,000+41%$60/sqft |
Source: Public Record Report a problem | ||
| 8/9/1999 | Sold | $53,900-7.4%$42/sqft |
Source: Public Record Report a problem | ||
| 4/29/1999 | Sold | $58,194$46/sqft |
Source: Public Record Report a problem | ||
| Year | Property taxes | Tax assessment |
|---|---|---|
| 2025 | $2,043 +3.4% | $210,600 +5.5% |
| 2024 | $1,976 +13.9% | $199,600 +13.9% |
| 2023 | $1,734 +8.2% | $175,200 +8.2% |
| 2022 | $1,603 +22.7% | $161,900 +22.7% |
| 2021 | $1,307 -8.9% | $132,000 +1.9% |
| 2020 | $1,434 +19.1% | $129,500 +7.8% |
| 2019 | $1,204 | $120,100 |
| 2018 | $1,204 | $120,100 |
| 2017 | $1,204 -32.1% | $120,100 +5.1% |
| 2016 | $1,774 +59% | $114,300 +1.4% |
| 2015 | $1,116 | $112,700 +6.7% |
| 2014 | $1,116 | $105,600 |
| 2013 | -- | $105,600 |
| 2012 | -- | $105,600 -10.3% |
| 2011 | -- | $117,700 -15.7% |
| 2010 | -- | $139,600 +2.4% |
| 2007 | -- | $136,310 +22.8% |
| 2006 | -- | $110,986 +16.4% |
| 2005 | -- | $95,330 +40% |
| 2004 | -- | $68,086 +9.7% |
| 2003 | -- | $62,086 +1.6% |
| 2002 | -- | $61,086 +3.4% |
| 2001 | -- | $59,086 |
Source: Bright MLS. This data may not be complete. We recommend contacting the local school district to confirm school assignments for this home.
A local agent can set up tours, give advice and negotiate with sellers.