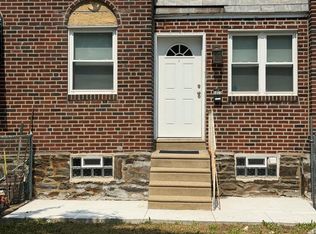
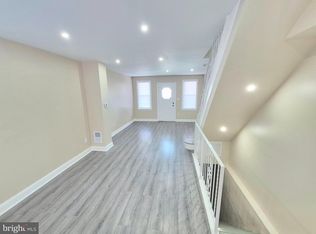
$170,200
3 bd2 ba654 sqft
5829 Bustleton Ave, Philadelphia, PA 19149
Off Market

Likely to sell faster than
Zillow last checked:
Listing updated:
Luis Maldonado 267-632-3511,
RE/MAX Select Group 2153356900

$215,700
$205,000 - $226,000
$1,327/mo
| Date | Event | Price |
|---|---|---|
| 11/2/2026 | Price change | $219,900-2.2%$336/sqft |
Source:  Bright MLS #PAPH2678204 Report a problem | ||
| 10/17/2026 | Price change | $224,900-2.2%$344/sqft |
Source: Bright MLS #PAPH2678204 Report a problem | ||
| 10/6/2026 | Listed for sale | $229,900+437.8%$352/sqft |
Source: Bright MLS #PAPH2678204 Report a problem | ||
| 1/2/2014 | Sold | $42,750-5%$65/sqft |
Source: Agent Provided Report a problem | ||
| 9/28/2013 | Listed for sale | $45,000-9.1%$69/sqft |
Source: Re/Max Eastern, Inc. #6285702 Report a problem | ||
| 8/7/2013 | Listing removed | $49,500$76/sqft |
Source: Philadelphia Regional Realty, LLC #6147052 Report a problem | ||
| 7/30/2013 | Price change | $49,500+2.1%$76/sqft |
Source: Philadelphia Regional Realty, LLC #6147052 Report a problem | ||
| 5/1/2013 | Price change | $48,500-11.8%$74/sqft |
Source: Philadelphia Regional Realty, LLC #6147052 Report a problem | ||
| 4/13/2013 | Price change | $55,000+10.4%$84/sqft |
Source: Philadelphia Regional Realty, LLC #6147052 Report a problem | ||
| 3/28/2013 | Price change | $49,800-0.2%$76/sqft |
Source: Philadelphia Regional Realty, LLC #6147052 Report a problem | ||
| 3/14/2013 | Price change | $49,900-16.7%$76/sqft |
Source: Philadelphia Regional Realty, LLC #6147052 Report a problem | ||
| 3/6/2013 | Price change | $59,900-6.3%$92/sqft |
Source: Philadelphia Regional Realty, LLC #6147052 Report a problem | ||
| 1/11/2013 | Price change | $63,900-8.6%$98/sqft |
Source: Philadelphia Regional Realty, LLC #6147052 Report a problem | ||
| 12/28/2012 | Listed for sale | $69,900+27.1%$107/sqft |
Source: Philadelphia Regional Realty, LLC #6147052 Report a problem | ||
| 11/1/1994 | Sold | $55,000$84/sqft |
Source: Public Record Report a problem | ||
| Year | Property taxes | Tax assessment |
|---|---|---|
| 2025 | $2,017 +27.1% | $144,100 +27.1% |
| 2024 | $1,587 | $113,400 |
| 2023 | $1,587 +29.2% | $113,400 |
| 2022 | $1,229 | -- |
| 2021 | $1,229 +4.2% | -- |
| 2018 | $1,180 | -- |
| 2017 | $1,180 -4.6% | -- |
| 2016 | $1,237 | -- |
| 2015 | $1,237 | -- |
| 2014 | $1,237 +4.5% | $88,400 +760.6% |
| 2012 | $1,185 | $10,272 |
| 2011 | -- | $10,272 |
| 2010 | -- | $10,272 |
| 2009 | -- | $10,272 |
| 2008 | -- | $10,272 |
| 2007 | -- | $10,272 +7.4% |
| 2006 | -- | $9,568 |
| 2005 | -- | $9,568 |
| 2004 | -- | $9,568 |
| 2003 | -- | $9,568 |
| 2002 | -- | $9,568 |
| 2000 | -- | $9,568 -12.1% |
| 1999 | -- | $10,880 |
Source: Bright MLS. This data may not be complete. We recommend contacting the local school district to confirm school assignments for this home.


A local agent can set up tours, give advice and negotiate with sellers.