Welcome to 5871 Memphis Arlington Rd. This spacious 3 bd/2ba home offers plenty of room to grow, gather, and create lasting memories! One of the standout feature is the inviting in ground pool, perfect for enjoying warm summer days. This home offers a wonderful opportunity for the next owner to bring their vision to life. With generous living space, a desirable layout, and plenty of potential, this home is ready for the right buyer to make it their own.
For sale
Price increase: $45K (11/20)
$425,000
5871 Memphis Arlington Rd, Bartlett, TN 38135
3beds
2,563sqft
Single Family Residence
Built in 1978
0.56 Acres Lot
$-- Zestimate®
$166/sqft
$-- HOA
What's special
Desirable layoutGenerous living spaceInviting in ground pool
- 2 hours
- 30
- 0
Zillow last checked:
Listing updated:
Listed by:
Sonya Harris,
Jason Mitchell Real Estate 805-233-2638
Source: MAAR,MLS#: 10234650
Facts & features
Interior
Bedrooms & bathrooms
- Bedrooms: 3
- Bathrooms: 2
- Full bathrooms: 2
Primary bedroom
- Dimensions: 0 x 0
Dining room
- Dimensions: 0 x 0
Kitchen
- Features: Washer/Dryer Connections, Kit/DR Combo
Living room
- Features: Great Room, LR/DR Combination
- Dimensions: 0 x 0
Den
- Dimensions: 0 x 0
Heating
- Central
Cooling
- Central Air
Features
- 1 or More BR Down, Primary Down, Split Bedroom Plan, Square Feet Source: AutoFill (MAARdata) or Public Records (Cnty Assessor Site)
- Flooring: Tile, Vinyl
- Number of fireplaces: 1
Interior area
- Total interior livable area: 2,563 sqft
Property
Parking
- Total spaces: 2
- Parking features: Garage Door Opener, Garage Faces Side
- Has garage: Yes
- Covered spaces: 2
Features
- Stories: 1.5
- Has private pool: Yes
- Pool features: Pool Cleaning Equipment, In Ground
Lot
- Size: 0.56 Acres
- Dimensions: 173 x 140
- Features: Some Trees
Details
- Parcel number: B0157S B00038
Construction
Type & style
- Home type: SingleFamily
- Architectural style: Traditional
- Property subtype: Single Family Residence
Condition
- New construction: No
- Year built: 1978
Community & HOA
Community
- Subdivision: Bartlett Estates East Sec E
Location
- Region: Bartlett
Financial & listing details
- Price per square foot: $166/sqft
- Tax assessed value: $385,700
- Annual tax amount: $4,195
- Price range: $425K - $425K
- Date on market: 11/20/2026
Estimated market value
Not available
Estimated sales range
Not available
$2,169/mo
Price history
| Date | Event | Price |
|---|---|---|
| 11/20/2026 | Price change | $425,000+11.8%$166/sqft |
Source:  MAAR #10234650 Report a problem | ||
| 9/25/2026 | Listed for sale | $380,000+0.3%$148/sqft |
Source: Owner Report a problem | ||
| 8/28/2024 | Listing removed | $2,800$1/sqft |
Source: Zillow Rentals Report a problem | ||
| 8/28/2024 | Price change | $2,800+1.8%$1/sqft |
Source: Zillow Rentals Report a problem | ||
| 8/22/2024 | Price change | $2,750-1.8%$1/sqft |
Source: Zillow Rentals Report a problem | ||
| 8/2/2024 | Price change | $2,7990%$1/sqft |
Source: Zillow Rentals Report a problem | ||
| 7/15/2024 | Listed for rent | $2,800+7.7%$1/sqft |
Source: Zillow Rentals Report a problem | ||
| 9/13/2023 | Listing removed | -- |
Source: Zillow Rentals Report a problem | ||
| 8/28/2023 | Listed for rent | $2,600-3.7%$1/sqft |
Source: Zillow Rentals Report a problem | ||
| 8/18/2023 | Listing removed | -- |
Source: Zillow Rentals Report a problem | ||
| 7/21/2023 | Listed for rent | $2,700$1/sqft |
Source: Zillow Rentals Report a problem | ||
| 8/1/2022 | Sold | $379,000$148/sqft |
Source: MAAR #10128017 Report a problem | ||
| 8/1/2022 | Pending sale | $379,000$148/sqft |
Source: MAAR #10128017 Report a problem | ||
| 7/6/2022 | Listed for sale | $379,000+124.3%$148/sqft |
Source: MAAR #10128017 Report a problem | ||
| 10/14/2021 | Sold | $169,000+6%$66/sqft |
Source: Public Record Report a problem | ||
| 5/28/1999 | Sold | $159,500$62/sqft |
Source: Public Record Report a problem | ||
Public tax history
| Year | Property taxes | Tax assessment |
|---|---|---|
| 2025 | $4,194 +16.2% | $96,425 +36.8% |
| 2024 | $3,610 | $70,500 |
| 2023 | $3,610 | $70,500 +22.1% |
| 2022 | -- | $57,725 |
| 2021 | -- | $57,725 +36.7% |
| 2020 | $773 | $42,225 |
| 2019 | $773 -54.8% | $42,225 |
| 2018 | $1,710 -31.8% | $42,225 |
| 2017 | $2,508 +291% | $42,225 +6.6% |
| 2016 | $642 +0.5% | $39,600 |
| 2014 | $638 | $39,600 |
| 2013 | -- | $39,600 -7.6% |
| 2012 | -- | $42,850 |
| 2011 | -- | $42,850 |
| 2010 | -- | $42,850 |
| 2009 | -- | $42,850 +6.8% |
| 2008 | -- | $40,125 |
| 2007 | -- | $40,125 |
| 2006 | -- | $40,125 |
| 2005 | -- | $40,125 +11.1% |
| 2004 | -- | $36,100 |
| 2003 | -- | $36,100 |
| 2002 | -- | $36,100 |
| 2001 | -- | $36,100 +6.6% |
| 2000 | -- | $33,875 |
Find assessor info on the county website
Monthly payment
Est. payment
Payment breakdown
Explore the cost of this home by adjusting the details. Changes won't be saved.Climate risks
Neighborhood: Bartlett Estates
- $294,5004 bd2 ba2.1k sqft5881 Memphis Arlington Rd, Memphis, TN 38135Off Market
- $329,1004 bd2 ba2.8k sqft5899 Memphis Arlington Rd, Memphis, TN 38135Off Market
- $273,7003 bd2 ba1.9k sqft5907 Pamela Ann Dr S, Bartlett, TN 38135Off Market
- $327,3004 bd3 ba2.2k sqft5911 Pamela Ann Dr S, Bartlett, TN 38135Off Market

Similar homes
- $--3 bd2 ba2k sqft6251 Skyview Cir, Bartlett, TN 38135Auction
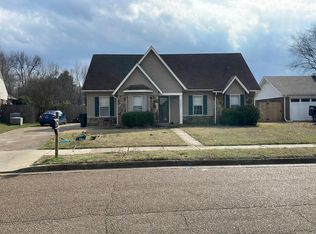 Auction.com 2
- $--4 bd3 ba2k sqft3482 Josee Ln, Bartlett, TN 38135Auction
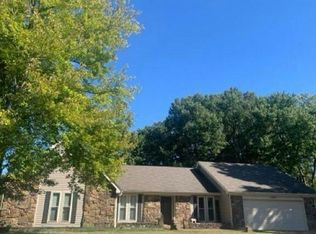 Auction.com 2
- $359,9004 bd3 ba2.3k sqft6774 Oakmoor Cir S, Bartlett, TN 38135For Sale
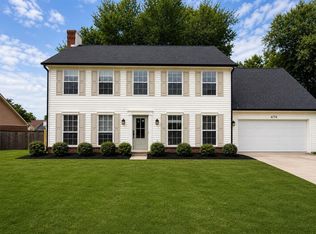 MLS ID #10234535, Joshua Moss, KAIZEN Realty, LLC. MAAR
- $310,0004 bd2 ba1.9k sqft3573 Skylight Dr E, Memphis, TN 38135For Sale
 MLS ID #10234640, Timothy Stewart, Tiger Realty. MAAR
- $415,0005 bd4 ba3.4k sqft6424 Hawks Call Ln, Bartlett, TN 38135For Sale
 MLS ID #3633354, Katy McAlexander. RealTracs MLS as distributed by MLS GRID
- $486,0005 bd4 ba3.6k sqft4197 Blackheath Dr, Memphis, TN 38135For SaleMLS ID #3635658, Venus Miller. RealTracs MLS as distributed by MLS GRID
