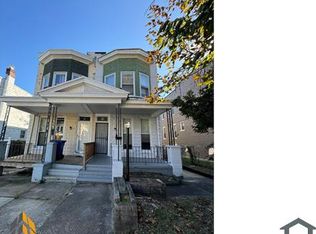
This is a 1728 square foot, 1.0 bathroom, townhome home. This home is located at 609 E 41st St, Baltimore, MD 21218.
Foreclosed
Est. $79,100
609 E 41st St, Baltimore, MD 21218
--beds
1baths
1,728sqft
Townhouse
Built in 1920
2,300 Square Feet Lot
$79,100 Zestimate®
$46/sqft
$-- HOA
Overview
- 150 days |
- 11 |
- 0 |
Facts & features
Interior
Bedrooms & bathrooms
- Bathrooms: 1
Heating
- Other
Features
- Basement: Partially finished
- Has fireplace: Yes
Interior area
- Total interior livable area: 1,728 sqft
Property
Features
- Exterior features: Cement / Concrete
Lot
- Size: 2,300 Square Feet
Details
- Parcel number: 09013912022
Construction
Type & style
- Home type: Townhouse
Materials
- Concrete Block
- Roof: Built-up
Condition
- Year built: 1920
Community & HOA
Location
- Region: Baltimore
Financial & listing details
- Price per square foot: $46/sqft
- Tax assessed value: $148,600
Visit our professional directory to find a foreclosure specialist in your area that can help with your home search.
Find a foreclosure agentForeclosure details
Estimated market value
$79,100
$72,000 - $87,000
$1,675/mo
Price history
| Date | Event | Price |
|---|---|---|
| 2/4/2026 | Sold | $134,400+22.3%$78/sqft |
Source: Public Record Report a problem | ||
| 5/15/2024 | Listing removed | -- |
Source: | ||
| 5/23/2023 | Contingent | $109,900$64/sqft |
Source: | ||
| 3/31/2023 | Listed for sale | $109,900$64/sqft |
Source: | ||
Public tax history
| Year | Property taxes | Tax assessment |
|---|---|---|
| 2025 | -- | $148,600 +7.5% |
| 2024 | $3,263 +8.1% | $138,267 +8.1% |
| 2023 | $3,019 +8.8% | $127,933 +8.8% |
| 2022 | $2,775 +2.1% | $117,600 +2.1% |
| 2021 | $2,718 +2.2% | $115,167 +2.2% |
| 2020 | $2,661 +2.2% | $112,733 +2.2% |
| 2019 | $2,603 | $110,300 |
| 2018 | $2,603 | $110,300 |
| 2017 | $2,603 +493.4% | $110,300 -3.7% |
| 2016 | $439 | $114,500 +9.2% |
| 2015 | $439 | $104,867 +10.1% |
| 2014 | $439 | $95,233 +11.3% |
| 2013 | -- | $85,600 +2.4% |
| 2012 | -- | $83,630 +2.4% |
| 2011 | -- | $81,660 +2.5% |
| 2010 | -- | $79,690 -15.8% |
| 2009 | -- | $94,680 +23.7% |
| 2008 | -- | $76,540 +31.1% |
| 2007 | -- | $58,400 +1.4% |
| 2006 | -- | $57,592 +1.4% |
| 2005 | -- | $56,786 +1.4% |
| 2004 | -- | $55,980 +7.2% |
| 2003 | -- | $52,206 +7.8% |
| 2002 | -- | $48,433 +8.4% |
| 2001 | -- | $44,660 |
Find assessor info on the county website
Monthly payment
Estimated monthly payment$1,822
All calculations are estimates and provided by Zillow, Inc. for informational purposes only. Actual amounts may vary.
HOA fees may include property taxes on listings classified as Co-Ops. Contact the listing agent and/or owner for fee details.
Mortgage interest rates are dependent on a number of factors, including credit score, down payment, and repayment length. Interest rate data provided by Zillow Group Marketplace, Inc. as of 1/1/1970 from various mortgage lenders with which we have lead or other similar arrangements; the Estimated Payment is an average of those rates.
See how much you could borrow to make a competitive offer.
Climate risks
Neighborhood: Pen Lucy
Nearby schools
GreatSchools rating
- 2/10Walter P. Carter Elementary SchoolGrades: PK-8Distance: 0.3 mi
- 5/10Stadium SchoolGrades: 6-8Distance: 1.3 mi
- 2/10Mergenthaler Vocational-Technical High SchoolGrades: 9-12Distance: 1 mi


- Maryland
- Baltimore City
- Baltimore
- 21218
- Pen Lucy
- 609 E 41st St
Nearby cities
Nearby neighborhoods
Nearby zip codes
Other Baltimore Topics
