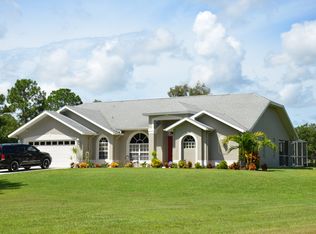
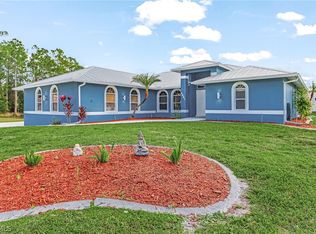
This 2390 square foot single family home has 3 bedrooms and 2.0 bathrooms. This home is located at 6430 Buckingham Rd, Fort Myers, FL 33905.
Pre-foreclosure
Street View
Est. $620,600
6430 Buckingham Rd, Fort Myers, FL 33905
3beds
2baths
2,390sqft
SingleFamily
Built in 1995
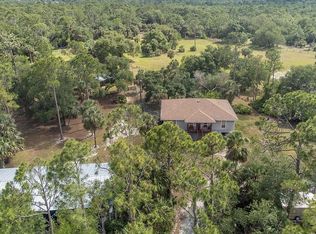
4.68 Acres Lot
$620,600 Zestimate®
$260/sqft
$-- HOA
Overview
- 182 days |
- 18 |
- 1 |
Facts & features
Interior
Bedrooms & bathrooms
- Bedrooms: 3
- Bathrooms: 2
Heating
- Forced air
Cooling
- Central
Features
- Flooring: Carpet
- Has fireplace: Yes
Interior area
- Total interior livable area: 2,390 sqft
Property
Parking
- Parking features: Garage - Attached
Features
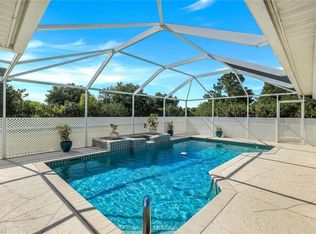
- Exterior features: Other
Lot
- Size: 4.68 Acres
Details
- Parcel number: 16442602000360210
Construction
Type & style
- Home type: SingleFamily
Materials
- Roof: Asphalt
Condition
- Year built: 1995
Community & HOA
Location
- Region: Fort Myers
Financial & listing details
- Price per square foot: $260/sqft
- Tax assessed value: $428,617
- Annual tax amount: $6,651
Visit our professional directory to find a foreclosure specialist in your area that can help with your home search.
Find a foreclosure agentForeclosure details
Estimated market value
$620,600
$552,000 - $689,000
$2,599/mo
Price history
| Date | Event | Price |
|---|---|---|
| 3/1/1991 | Sold | $39,000$16/sqft |
Source: Agent Provided Report a problem | ||
Public tax history
| Year | Property taxes | Tax assessment |
|---|---|---|
| 2025 | $6,651 +8% | $428,617 +7.7% |
| 2024 | $6,159 -23% | $398,017 -15.2% |
| 2023 | $7,997 +10.7% | $469,616 +10% |
| 2022 | $7,224 +15.8% | $426,924 +10% |
| 2021 | $6,241 +4.7% | $388,113 +6.1% |
| 2020 | $5,958 +121.1% | $365,799 +3.9% |
| 2019 | $2,694 | $352,063 +94.9% |
| 2018 | $2,694 +0.4% | $180,671 +2.7% |
| 2017 | $2,683 +0.8% | $175,931 -35.4% |
| 2016 | $2,662 +2.1% | $272,318 +24.4% |
| 2015 | $2,606 +2.2% | $218,892 +10.1% |
| 2014 | $2,551 +0.9% | $198,900 0% |
| 2013 | $2,529 +3.6% | $198,906 +9.9% |
| 2012 | $2,442 +1.1% | $180,997 +13.4% |
| 2011 | $2,414 -21.7% | $159,661 -18.2% |
| 2010 | $3,084 -5.4% | $195,099 -16.1% |
| 2009 | $3,260 +5.5% | $232,400 -32.1% |
| 2008 | $3,089 -1.5% | $342,040 -22.5% |
| 2007 | $3,136 -3.3% | $441,430 +14.1% |
| 2006 | $3,244 -4.7% | $386,780 +57.5% |
| 2004 | $3,403 -2.1% | $245,650 +8.3% |
| 2003 | $3,475 +3.3% | $226,850 +4.2% |
| 2002 | $3,363 | $217,700 +25.6% |
| 2000 | -- | $173,320 |
Find assessor info on the county website
Monthly payment
Estimated monthly payment$1,822
All calculations are estimates and provided by Zillow, Inc. for informational purposes only. Actual amounts may vary.
HOA fees may include property taxes on listings classified as Co-Ops. Contact the listing agent and/or owner for fee details.
Mortgage interest rates are dependent on a number of factors, including credit score, down payment, and repayment length. Interest rate data provided by Zillow Group Marketplace, Inc. as of 1/1/1970 from various mortgage lenders with which we have lead or other similar arrangements; the Estimated Payment is an average of those rates.
See how much you could borrow to make a competitive offer.
Climate risks
Neighborhood: Buckingham Park
Nearby schools
GreatSchools rating
- 2/10Tortuga Preserve Elementary SchoolGrades: PK-5Distance: 1.5 mi
- 6/10Harns Marsh Middle SchoolGrades: 6-8Distance: 1.8 mi
- 3/10Lehigh Senior High SchoolGrades: 9-12Distance: 1.9 mi


- Florida
- Lee County
- Fort Myers
- 33905
- Buckingham Park
- 6430 Buckingham Rd
Nearby cities
Nearby neighborhoods
Nearby zip codes
Other Fort Myers Topics
