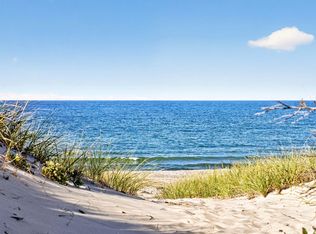
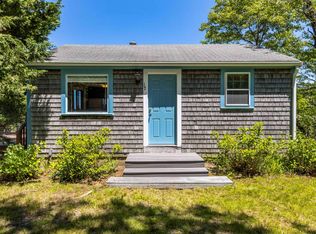
Enjoy Cape Cod's fall season, known locally as the "Second Summer," in this sweet cottage. Fall on the Cape offers a quieter, more affordable escape with fewer crowds, mild weather, and vibrant autumn scenery. Just a short trek over the bridge and you've arrived in the coveted neighborhood of Sandwich Downs, a sought-after enclave of homes with deeded rights to a private beach on Cape Cod Bay known for calm waters and sandbars at low tide. Situated on an oversized lot, this updated 2 bed/1.5 bath cottage is year-round, ready to enjoy right now and has possibility for expansion. The interior is bright and inviting. Upper and lower decks provide space for entertaining, outdoor dining or simply relaxing after a long day at the beach. The second-floor deck is a great spot for stunning sunsets and seasonal views of the ocean. The yard is large, level and has an outdoor shower, along with a shed that has power. Whether you like to kayak, bike, or swim this peaceful neighborhood has it all. Just a short distance to the beach, this is a rare opportunity to own your very own Cape Cod getaway with private beach rights or perhaps an opportunity to create the home of your dreams.
Pending
$840,000
65 Wing Boulevard W, East Sandwich, MA 02537
2beds
806sqft
Single Family Residence
Built in 1940
0.37 Acres Lot
$818,300 Zestimate®
$1,042/sqft
$-- HOA
What's special
Outdoor showerOversized lotShed that has power
- 139 days
- 230
- 9
Zillow last checked:
Listing updated:
Listed by:
Brenda Bourne 774-209-1428,
Pleasant Bay Realty
Source: CCIMLS,MLS#: 22602708
Facts & features
Interior
Bedrooms & bathrooms
- Bedrooms: 2
- Bathrooms: 2
- Full bathrooms: 1
- 1/2 bathrooms: 1
Heating
- Natural Gas
Cooling
- None
Appliances
- Included: Microwave, Gas Range, Refrigerator, Washer/Dryer Stacked, Natural Gas, Tankless Water Heater
Features
- Flooring: Vinyl, Tile
Interior area
- Total structure area: 806
- Total interior livable area: 806 sqft
Property
Parking
- Total spaces: 5
- Parking features: Driveway
- Has uncovered spaces: Yes
Features
- Stories: 2
- Patio & porch: Deck, Porch
- Exterior features: Outdoor Shower
Lot
- Size: 0.37 Acres
- Features: Cleared, Level
Details
- Additional structures: Outbuilding
- Parcel number: SAND M:0055 B:0000 L:00430
- Special conditions: None
Construction
Type & style
- Home type: SingleFamily
- Property subtype: Single Family Residence
Materials
- Shingle Siding
- Roof: Asphalt
Condition
- Year built: 1940
Utilities & green energy
- Water: Well
Community & HOA
Community
- Features: Deeded Beach Rights
- Subdivision: Sandwich Downs
HOA
- Has HOA: No
- Amenities included: Beach Access, Road Maintenance
Location
- Region: East Sandwich
Financial & listing details
- Price per square foot: $1,042/sqft
- Tax assessed value: $893,100
- Annual tax amount: $9,101
- Date on market: 6/5/2026
- Cumulative days on market: 160 days
Estimated market value
$818,300
$777,000 - $859,000
$2,641/mo
Price history
| Date | Event | Price |
|---|---|---|
| 9/29/2026 | Pending sale | $840,000$1,042/sqft |
Source:  CCIMLS #22602708 Report a problem | ||
| 9/14/2026 | Listed for sale | $840,000-1.2%$1,042/sqft |
Source: CCIMLS #22602708 Report a problem | ||
| 9/1/2026 | Listing removed | $850,000$1,055/sqft |
Source: CCIMLS #22602708 Report a problem | ||
| 8/25/2026 | Listed for sale | $850,000$1,055/sqft |
Source: CCIMLS #22602708 Report a problem | ||
| 8/18/2026 | Pending sale | $850,000$1,055/sqft |
Source: CCIMLS #22602708 Report a problem | ||
| 6/5/2026 | Listed for sale | $850,000-2.9%$1,055/sqft |
Source: CCIMLS #22602708 Report a problem | ||
| 6/4/2026 | Listing removed | $875,000$1,086/sqft |
Source: CCIMLS #22600903 Report a problem | ||
| 5/7/2026 | Price change | $875,000-2.7%$1,086/sqft |
Source: CCIMLS #22600903 Report a problem | ||
| 4/4/2026 | Listed for sale | $899,000-0.1%$1,115/sqft |
Source: CCIMLS #22600903 Report a problem | ||
| 9/18/2025 | Listing removed | $900,000$1,117/sqft |
Source: CCIMLS #22503632 Report a problem | ||
| 8/5/2025 | Listed for sale | $900,000+176.9%$1,117/sqft |
Source: CCIMLS #22503632 Report a problem | ||
| 12/13/2013 | Sold | $325,000$403/sqft |
Source: CCIMLS #21307327 Report a problem | ||
Public tax history
| Year | Property taxes | Tax assessment |
|---|---|---|
| 2025 | $8,849 +6.1% | $837,200 +8.4% |
| 2024 | $8,343 +43.4% | $772,500 +52.7% |
| 2023 | $5,817 +0.6% | $505,800 +15.1% |
| 2022 | $5,785 -1.9% | $439,600 +2.6% |
| 2021 | $5,899 +0.3% | $428,400 +4.2% |
| 2020 | $5,884 +15.7% | $411,200 +15.8% |
| 2019 | $5,084 -3.8% | $355,000 -4% |
| 2018 | $5,283 +0.9% | $369,700 +5.4% |
| 2017 | $5,237 +7.3% | $350,800 +4% |
| 2016 | $4,879 -0.6% | $337,200 +1.8% |
| 2015 | $4,910 +6.7% | $331,300 +4.9% |
| 2014 | $4,603 -0.5% | $315,900 -6.3% |
| 2013 | $4,628 +5.1% | $337,300 -2.4% |
| 2012 | $4,402 +2.4% | $345,500 -2.1% |
| 2011 | $4,297 +7.4% | $352,800 -0.9% |
| 2010 | $4,000 +0.8% | $355,900 -7.9% |
| 2009 | $3,968 +9.9% | $386,400 +2.9% |
| 2008 | $3,610 +31.4% | $375,600 +27.1% |
| 2007 | $2,747 +9.6% | $295,400 +10.3% |
| 2006 | $2,506 +7.4% | $267,700 +9.5% |
| 2005 | $2,333 +11.1% | $244,500 +18.7% |
| 2004 | $2,100 +6.5% | $205,900 +23.1% |
| 2003 | $1,971 +10.6% | $167,200 +25.7% |
| 2001 | $1,782 +7% | $133,000 +14.2% |
| 2000 | $1,666 | $116,500 |
Find assessor info on the county website
Monthly payment
Est. payment
Payment breakdown
Explore the cost of this home by adjusting the details. Changes won't be saved.Climate risks
Neighborhood: 02537

Similar homes
- $849,9003 bd1 ba912 sqft143 N Shore Boulevard UNIT 7A, East Sandwich, MA 02537For Sale
 MLS ID #22604666, Tori Harrison Farr, Sotheby's International Realty, Inc.. CCIMLS
- $475,0002 bd1 ba682 sqft77 Ploughed Neck Road, East Sandwich, MA 02537For Sale
 MLS ID #22604645, Paula T Casey, Beach Realty. CCIMLS
- $899,0002 bd1 ba989 sqft21 Green Acres Ln, Forestdale, MA 02644For Sale
 MLS ID #73498755, Kevin Cosgrove, Kinlin Grover Compass. MLS PIN
- $549,9002 bd1 ba480 sqft507 Route 6A UNIT 17, East Sandwich, MA 02537For Sale
 MLS ID #22602758, Mason Hickman, eXp Realty, LLC. CCIMLS
- $893,0003 bd2 ba1.1k sqft65 Kings Row Drive, East Dennis, MA 02641For SaleMLS ID #22603722, Sandra Clarke, William Raveis Real Estate & Home Services. CCIMLS
- $679,0002 bd2 ba1.1k sqft7 Spinning Brook Road, South Yarmouth, MA 02664For SaleMLS ID #22605311, Galya Mihaylova - Assaker, Today Real Estate. CCIMLS
- $629,9002 bd2 ba1k sqft55 Seth Goodspeed Way, Osterville, MA 02655For SaleMLS ID #22601981, Donna Christopher, Sotheby's International Realty. CCIMLS
- $789,0003 bd2 ba1k sqft19 Joe Lincoln Road, West Harwich, MA 02671For SaleMLS ID #22605135, James Andrea, Lamacchia Realty, Inc.. CCIMLS
- $574,9002 bd2 ba1k sqft64 Camp Opechee Road, Centerville, MA 02632For SaleMLS ID #22603713, Susan Kadilak, Fiv Realty Co Massachussetts LLC. CCIMLS
- $679,0003 bd3 ba1.1k sqft38 Captain Small Road, South Yarmouth, MA 02664For SaleMLS ID #22605280, Tori Harrison Farr, Sotheby's International Realty, Inc.. CCIMLS
- $489,0002 bd1 ba1k sqft16 Lakeside Drive, Marstons Mills, MA 02648For SaleMLS ID #22605252, Mike B Fitzgibbons, Property Partners Real Estate, LLC. CCIMLS
- $520,0002 bd1 ba976 sqft25 Raspberry Lane, Marstons Mills, MA 02648For SaleMLS ID #22604660, Bryony Scudder, Today Real Estate. CCIMLS
- $749,0002 bd3 ba1k sqft215 Route 6A, Dennis, MA 02638For SaleMLS ID #22603071, Ronald Nelson, Gibson Sotheby's International Realty. CCIMLS
- $584,9003 bd1 ba746 sqft1825 Main Street #6A, West Barnstable, MA 02668For SaleMLS ID #22604618, Leighton Team, Keller Williams Realty. CCIMLS
- $784,9003 bd2 ba1k sqft5 Water Street, West Yarmouth, MA 02673For SaleMLS ID #22603618, The Sampson and Stuart Team, William Raveis Real Estate & Home Services. CCIMLS
- $579,0002 bd2 ba1.1k sqft804 Putnam Avenue, Cotuit, MA 02635For SaleMLS ID #22603655, Ryan Mann, Sotheby's International Realty. CCIMLS
- $499,0003 bd2 ba1k sqft5 Freighthouse Road, Sagamore, MA 02561For SaleMLS ID #22603804, Sandra Milano, RE/MAX Executive Realty. CCIMLS
