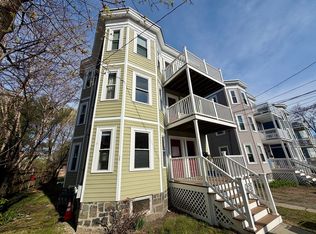
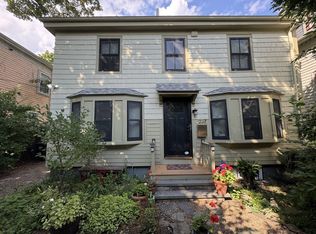
Well-maintained three-family property located just off Garden Street. Current leases in place through May 31, 2027. The building features three sunny, floor-through units, each offering high ceilings, hardwood floors, kitchen pantries, and separate systems. Front and rear decks are included with each unit. Additional features include a full unfinished basement, a side yard, and a spacious backyard. A solid investment property with potential for condo conversion. Conveniently located, with easy access to Porter Square and Fresh Pond.
For sale
$2,375,000
7 Orrin St, Cambridge, MA 02138
6beds
3,342sqft
3 Family
Built in 1911
-- sqft lot
$-- Zestimate®
$711/sqft
$-- HOA
What's special
- 78 days |
- 163 |
- 1 |
Likely to sell faster than
Zillow last checked:
Listing updated:
Listed by:
Maggie Dee + Charles Cherney Team 617-634-9665,
Compass 617-303-0067
Source: MLS PIN,MLS#: 73503289
Loading...
Facts & features
Interior
Bedrooms & bathrooms
- Bedrooms: 6
- Bathrooms: 3
- Full bathrooms: 3
Features
- Flooring: Tile, Hardwood
- Basement: Full,Walk-Out Access,Interior Entry
- Has fireplace: No
Interior area
- Total structure area: 3,342
- Total interior livable area: 3,342 sqft
- Finished area above ground: 3,342
Property
Features
- Patio & porch: Covered
- Fencing: Fenced
Lot
- Size: 3,703 Square Feet
- Features: Level
Details
- Parcel number: CAMBM00229L00069
- Zoning: res.
Construction
Type & style
- Home type: MultiFamily
- Property subtype: 3 Family
Materials
- Frame
- Foundation: Block, Stone
- Roof: Rubber
Condition
- Year built: 1911
Utilities & green energy
- Electric: Circuit Breakers
- Sewer: Public Sewer
- Water: Public
- Utilities for property: for Gas Range
Community & HOA
Community
- Features: Public Transportation, Shopping, Park, Highway Access
Location
- Region: Cambridge
Financial & listing details
- Price per square foot: $711/sqft
- Tax assessed value: $1,790,700
- Annual tax amount: $12,282
- Date on market: 4/16/2026
- Total actual rent: 10225
Estimated market value
Not available
Estimated sales range
Not available
$3,142/mo
Price history
| Date | Event | Price |
|---|---|---|
| 4/17/2026 | Listed for sale | $2,375,000$711/sqft |
Source: MLS PIN #73503289 Report a problem | ||
| 3/28/2025 | Listing removed | $3,300$1/sqft |
Source: Zillow Rentals Report a problem | ||
| 2/21/2025 | Listed for rent | $3,300+22.2%$1/sqft |
Source: Zillow Rentals Report a problem | ||
| 3/12/2022 | Listing removed | -- |
Source: Zillow Rental Manager Report a problem | ||
| 3/11/2022 | Listed for rent | $2,700+8%$1/sqft |
Source: Zillow Rental Manager Report a problem | ||
| 4/3/2019 | Listing removed | $2,500$1/sqft |
Source: Apartment Rental Experts Report a problem | ||
| 3/19/2019 | Listed for rent | $2,500$1/sqft |
Source: Apartment Rental Experts Report a problem | ||
| 11/13/2018 | Listing removed | $2,500$1/sqft |
Source: Apartment Rental Experts Report a problem | ||
| 8/30/2018 | Listed for rent | $2,500$1/sqft |
Source: Apartment Rental Experts Report a problem | ||
| 3/10/2018 | Listing removed | $2,500$1/sqft |
Source: Apartment Rental Experts Report a problem | ||
| 2/25/2018 | Listed for rent | $2,500$1/sqft |
Source: Apartment Rental Experts Report a problem | ||
Public tax history
| Year | Property taxes | Tax assessment |
|---|---|---|
| 2025 | $11,003 +7.6% | $1,732,800 +0.3% |
| 2024 | $10,227 +6% | $1,727,500 +4.9% |
| 2023 | $9,652 +5.2% | $1,647,100 +6.2% |
| 2022 | $9,178 +4.3% | $1,550,400 +3.1% |
| 2021 | $8,801 +1.1% | $1,504,400 -0.6% |
| 2020 | $8,707 +13% | $1,514,200 +16.7% |
| 2019 | $7,704 +6.4% | $1,297,000 +12.7% |
| 2018 | $7,239 -3.5% | $1,150,900 -0.4% |
| 2017 | $7,498 -0.3% | $1,155,300 +7.4% |
| 2016 | $7,520 +2.6% | $1,075,800 +14.7% |
| 2015 | $7,332 +4.7% | $937,600 +12.2% |
| 2014 | $7,001 -0.8% | $835,500 +2.5% |
| 2013 | $7,060 +4.3% | $815,200 +2.2% |
| 2012 | $6,766 -6.9% | $797,900 -10.4% |
| 2011 | $7,264 +5.1% | $890,200 -0.5% |
| 2010 | $6,909 +1.3% | $895,000 -0.8% |
| 2009 | $6,819 +0.5% | $902,000 -2.1% |
| 2008 | $6,782 -5.5% | $921,500 -4% |
| 2007 | $7,180 -1.2% | $959,900 -2.5% |
| 2006 | $7,266 -10.6% | $984,500 -5.8% |
| 2005 | $8,129 +60.8% | $1,044,800 +57.7% |
| 2004 | $5,054 +15.6% | $662,400 +10% |
| 2003 | $4,372 +2.1% | $602,200 +1.5% |
| 2002 | $4,284 +18.9% | $593,300 +58.7% |
| 2000 | $3,603 | $373,800 +10% |
| 1999 | -- | $339,800 |
Find assessor info on the county website
Monthly payment
Est. payment$--/mo
Payment breakdown
Explore the cost of this home by adjusting the details. Changes won't be saved.All calculations are estimates and provided by Zillow, Inc. for informational purposes only. Actual amounts may vary.
HOA fees may include property taxes on listings classified as Co-Ops. Contact the listing agent and/or owner for fee details.
Mortgage interest rates are dependent on a number of factors, including credit score, down payment, and repayment length. Interest rate data provided by Zillow Group Marketplace, Inc. as of 1/1/1970 from various mortgage lenders with which we have lead or other similar arrangements; the Estimated Payment is an average of those rates.
See how much you could borrow to make a competitive offer.
Climate risks
Neighborhood: Peabody
Nearby schools
GreatSchools rating
- 7/10Peabody SchoolGrades: PK-5Distance: 0.5 mi
- 8/10Rindge Avenue Upper SchoolGrades: 6-8Distance: 0.5 mi
- 8/10Cambridge Rindge and Latin SchoolGrades: 9-12Distance: 1.2 mi


A local agent can set up tours, give advice and negotiate with sellers.
A local lender can help you make sure your offer is ready when you are.


Nearby cities
Nearby neighborhoods
Nearby zip codes
Other Cambridge Topics
