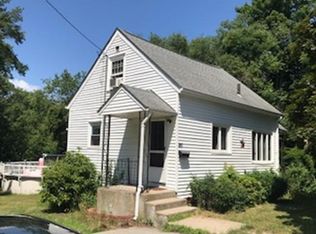
Welcome to this well-maintained single-family home in Attleboro offering the perfect combination of space, comfort, and convenience. This inviting home features 4 bedrooms and 2 full bathrooms with an open floor plan designed for today's lifestyle. The spacious kitchen is equipped with stainless steel appliances, ample cabinetry, and flows seamlessly into the main living areas, making it ideal for everyday living and entertaining. The home has been meticulously maintained and offers abundant natural light throughout. Step outside to enjoy the good-sized yard, along with plenty of off-street parking. Located in an established residential neighborhood close to schools, parks, and community services. Minutes to Downtown Attleboro, local restaurants, shopping, and entertainment. Easy access to Interstate 95 and Route 1. Close to Attleboro Station, Capron Park, Emerald Square Mall, healthcare, and just 20 minutes to Providence and 45–50 minutes to Boston.
For sale
Price cut: $10.1K (7/22)
$539,900
70 Riverside Ave, Attleboro, MA 02703
4beds
1,732sqft
:
Get pre-qualified$3,512/mo
Single Family Residence
Built in 1946
0.49 Acres Lot
$533,600 Zestimate®
$312/sqft
$-- HOA
What's special
Good-sized yardOpen floor planStainless steel appliancesPlenty of off-street parkingAmple cabinetryAbundant natural light throughoutSpacious kitchen
- 21 days |
- 1,358 |
- 76 |
Likely to sell faster than
Zillow last checked:
Listing updated:
Listed by:
Kyle Seyboth 508-726-3492,
Century 21 Limitless 508-726-3492
Source: MLS PIN,MLS#: 73545471
Facts & features
Interior
Bedrooms & bathrooms
- Bedrooms: 4
- Bathrooms: 2
- Full bathrooms: 2
Heating
- Steam, Oil
Cooling
- None
Features
- Basement: Full,Unfinished
- Has fireplace: No
Interior area
- Total structure area: 1,732
- Total interior livable area: 1,732 sqft
- Finished area above ground: 1,732
Property
Parking
- Total spaces: 9
- Parking features: Off Street
- Uncovered spaces: 9
Features
- Has view: Yes
- View description: Water, Lake
- Has water view: Yes
- Water view: Lake,Water
- Waterfront features: Waterfront, Lake
Lot
- Size: 0.49 Acres
- Features: Level
Details
- Parcel number: M:0035 B:0000 L:0012,2757293
- Zoning: R1
Construction
Type & style
- Home type: SingleFamily
- Architectural style: Colonial
- Property subtype: Single Family Residence
Materials
- Foundation: Concrete Perimeter
Condition
- Year built: 1946
Utilities & green energy
- Sewer: Public Sewer
- Water: Public
Community & HOA
HOA
- Has HOA: No
Location
- Region: Attleboro
Financial & listing details
- Price per square foot: $312/sqft
- Tax assessed value: $437,200
- Annual tax amount: $5,334
- Date on market: 7/7/2026
Estimated market value
$533,600
$507,000 - $560,000
$3,233/mo
Price history
| Date | Event | Price |
|---|---|---|
| 7/22/2026 | Price change | $539,900-1.8%$312/sqft |
Source: MLS PIN #73545471 Report a problem | ||
| 7/7/2026 | Listed for sale | $550,000+0.9%$318/sqft |
Source: MLS PIN #73545471 Report a problem | ||
| 6/25/2026 | Listing removed | $545,000$315/sqft |
Source: MLS PIN #73527396 Report a problem | ||
| 6/1/2026 | Listed for sale | $545,000-0.9%$315/sqft |
Source: MLS PIN #73527396 Report a problem | ||
| 6/1/2026 | Listing removed | $549,900$317/sqft |
Source: MLS PIN #73495464 Report a problem | ||
| 4/27/2026 | Price change | $549,900-1.8%$317/sqft |
Source: MLS PIN #73495464 Report a problem | ||
| 4/10/2026 | Price change | $559,900-1.8%$323/sqft |
Source: MLS PIN #73495464 Report a problem | ||
| 4/2/2026 | Listed for sale | $570,000+1.8%$329/sqft |
Source: MLS PIN #73495464 Report a problem | ||
| 4/2/2026 | Listing removed | $560,000-1.8%$323/sqft |
Source: MLS PIN #73457195 Report a problem | ||
| 11/22/2025 | Listed for sale | $570,000+78.1%$329/sqft |
Source: MLS PIN #73457195 Report a problem | ||
| 1/19/2021 | Sold | $320,000-5.9%$185/sqft |
Source: | ||
| 10/17/2020 | Price change | $339,900-2.9%$196/sqft |
Source: Hannon Realty Group #1264652 Report a problem | ||
| 9/15/2020 | Listed for sale | $349,900+88.6%$202/sqft |
Source: Hannon Realty Group #1264652 Report a problem | ||
| 8/18/2015 | Sold | $185,500+3.3%$107/sqft |
Source: Public Record Report a problem | ||
| 6/3/2015 | Pending sale | $179,500$104/sqft |
Source: CENTURY 21 Ed Pariseau, Realtors #71822941 Report a problem | ||
| 4/23/2015 | Listed for sale | $179,500$104/sqft |
Source: CENTURY 21 Ed Pariseau, REALTORS #71822941 Report a problem | ||
Public tax history
| Year | Property taxes | Tax assessment |
|---|---|---|
| 2025 | $5,140 +0% | $409,600 +1.5% |
| 2024 | $5,138 +4.8% | $403,600 +12.7% |
| 2023 | $4,904 +6.8% | $358,200 +12.7% |
| 2022 | $4,591 +9.9% | $317,700 +12.5% |
| 2021 | $4,178 +1.9% | $282,300 +0.2% |
| 2020 | $4,100 +7.8% | $281,600 +4.8% |
| 2019 | $3,803 +12% | $268,600 +17.2% |
| 2018 | $3,395 +1% | $229,100 -0.8% |
| 2017 | $3,361 +14.8% | $231,000 +17% |
| 2016 | $2,927 +10% | $197,500 +9.2% |
| 2015 | $2,660 +3.4% | $180,800 +4.4% |
| 2014 | $2,572 -0.8% | $173,200 -7.3% |
| 2013 | $2,594 +0.1% | $186,900 -7.1% |
| 2012 | $2,591 +0.5% | $201,200 -4.8% |
| 2011 | $2,579 -0.8% | $211,400 -9% |
| 2010 | $2,601 +2.8% | $232,200 -7.4% |
| 2009 | $2,531 -0.2% | $250,800 -6.7% |
| 2008 | $2,537 +0.4% | $268,800 +2.9% |
| 2007 | $2,527 +6.2% | $261,300 +7% |
| 2006 | $2,379 +6.8% | $244,200 +10.6% |
| 2005 | $2,228 +10.1% | $220,800 +45.6% |
| 2004 | $2,024 +7.5% | $151,700 +4.4% |
| 2003 | $1,882 +8.8% | $145,300 +32.7% |
| 2001 | $1,730 +3% | $109,500 |
| 2000 | $1,680 +11.9% | $109,500 -7.7% |
| 1995 | $1,501 | $118,600 |
Find assessor info on the county website
Monthly payment
Est. payment
Payment breakdown
Explore the cost of this home by adjusting the details. Changes won't be saved.Climate risks
Neighborhood: 02703
Nearby schools
GreatSchools rating
- 6/10Peter Thacher Elementary SchoolGrades: K-4Distance: 0.3 mi
- 5/10Cyril K. Brennan Middle SchoolGrades: 5-8Distance: 1.2 mi
- 5/10Attleboro High SchoolGrades: 9-12Distance: 1.1 mi
- $402,2003 bd2 ba816 sqft64 Riverside Ave, Attleboro, MA 02703Off Market
- $379,1002 bd1 ba744 sqft80 Riverside Ave, Attleboro, MA 02703Off Market
- $775,8006 bd4 ba3k sqft65-67 Riverside Ave, Attleboro, MA 02703Off Market
- $--6 bd4 ba2.7k sqft65-67 Riverside Ave, Attleboro, MA 02703Off Market
- $306,3003 bd1 ba1.1k sqft65 Riverside Ave #65, Attleboro, MA 02703Off Market
- $575,8004 bd2 ba1.6k sqft56 Riverside Ave, Attleboro, MA 02703Off Market
- $692,4004 bd2 ba2.7k sqft11 Spring St, Attleboro, MA 02703Off Market
- $--2 bd1 ba-- sqft11 Spring St #1, Attleboro, MA 02703Off Market
A local agent can set up tours, give advice and negotiate with sellers.
A local lender can help you make sure your offer is ready when you are.
Similar homes
- $560,0003 bd2 ba2k sqft3 Willett Dr, Attleboro, MA 02703For Sale
 MLS ID #73522249, Kenneth Farrow, RE/MAX Real Estate Center. MLS PIN
 - $599,0003 bd2 ba1.8k sqft460 Richardson Ave, Attleboro, MA 02703For Sale
 MLS ID #73553627, Lori Seavey Realty Team, Keller Williams Elite. MLS PIN
 - $525,0004 bd2 ba1.1k sqft14 Sibley St, Attleboro, MA 02703For Sale
 MLS ID #73548633, Randi Giles, Coldwell Banker Realty. MLS PIN
 - $559,9003 bd2 ba1.6k sqft22 Union Rd, Norton, MA 02766For Sale
 MLS ID #73554002, Maria Gorman, Coldwell Banker Realty - Westwood. MLS PIN
 - $430,0004 bd1 ba1.1k sqft386 Thacher St, Attleboro, MA 02703For SaleMLS ID #73532347, Marina Korenblyum, Redfin Corp.. MLS PIN
- $669,0003 bd3 ba1.5k sqft14 Wilmarth St, Attleboro, MA 02703For SaleMLS ID #73522284, Donald Savastano, The Nest Real Estate Agency, LLC. MLS PIN
- $579,9004 bd2 ba1.5k sqft18 Peck St, North Attleboro, MA 02760For SaleMLS ID #73519313, Cheryl Walsh, C. Walsh Realty, Inc.. MLS PIN
- $550,0006 bd4 ba2k sqft20 School St, Rehoboth, MA 02769For SaleMLS ID #73530983, Alysandra Nemeth, Redfin Corp.. MLS PIN
- $580,0004 bd2 ba1.4k sqft5 Colfall St, Seekonk, MA 02771For SaleMLS ID #73553525, Reserve Team, Reference Real Estate. MLS PIN
- $479,9003 bd2 ba1.6k sqft79 Central Ave, Seekonk, MA 02771For SaleMLS ID #73433905, Nickko Gomes, eXp Realty LLC. MLS PIN
- $559,9004 bd2 ba1.9k sqft2800 Anderson Dr, Dighton, MA 02715For SaleMLS ID #73527908, Jonathan Ashbridge, Keller Williams Realty. MLS PIN
- $630,0003 bd2 ba2.4k sqft27 Mary Kennedy Dr, North Attleboro, MA 02760For SaleMLS ID #73546153, Bernardine Cesar, Keller Williams Elite. MLS PIN
- $535,0004 bd1 ba2.1k sqft40 Doty Dr, Stoughton, MA 02072For SaleMLS ID #73553610, Susan Gooltz, Coldwell Banker Realty - Sharon. MLS PIN
- $540,0003 bd2 ba1.5k sqft22 Balmoral Ct, Seekonk, MA 02771For SaleMLS ID #73522176, Christopher Mongeon, Peak Real Estate. MLS PIN
- $599,9003 bd2 ba1.7k sqft166 School St, Rehoboth, MA 02769For SaleMLS ID #73545692, Jenna Danielli, LPT Realty - Home & Key Group. MLS PIN
- $519,0003 bd1 ba912 sqft543 Cross St, Bridgewater, MA 02324For SaleMLS ID #73553665, Katrina Lehtola, Gray Owl Realty & Renovation LLC. MLS PIN
- $574,9003 bd2 ba1.4k sqft433 Pearse Rd, Swansea, MA 02777For SaleMLS ID #73544985, Christopher R. Carreiro, Esquire, Lands End Realty, Inc.. MLS PIN
- $515,0003 bd1 ba928 sqft20 Rayburn Rd, Stoughton, MA 02072For SaleMLS ID #73555059, Maria Terova, William Raveis R.E. & Home Services. MLS PIN
- $629,9004 bd3 ba1.8k sqft262 Daniels St, Franklin, MA 02038For SaleMLS ID #73545085, Molla Realty Team, Costello Realty. MLS PIN
- $699,0003 bd3 ba1.6k sqft275 Summer St, Rehoboth, MA 02769For SaleMLS ID #73542306, Russell Weddell, Keller Williams South Watuppa. MLS PIN
