Spacious Townhouse Style Condo: End unit with only one common wall. Conveniently Located in West Paramount close to freeway. Nearby schools and parks. Back entrance from a double car garage walk through a private patio and enter through a double glass sliding door.
For sale
Listed by: The Real Estate Solution • Alfred Hernandez • 562-708-3608
$489,900
7017 Myrrh St, Paramount, CA 90723
2beds
1,166sqft
Condominium
Built in 1979
-- sqft lot
$485,000 Zestimate®
$420/sqft
$-- HOA
What's special
- 44 days
- 188
- 8
Zillow last checked:
Listing updated:
Listed by:
Alfred Hernandez DRE #01182867 562-708-3608,
The Real Estate Solution
Source: CRMLS,MLS#: DW26205117 Originating MLS: California Regional MLS
Facts & features
Interior
Bedrooms & bathrooms
- Bedrooms: 2
- Bathrooms: 2
- Full bathrooms: 1
- 1/2 bathrooms: 1
- Main level bathrooms: 1
Rooms
- Room types: Bedroom, Laundry, Living Room
Bedroom
- Features: All Bedrooms Up
Bathroom
- Features: Tub Shower
Heating
- Forced Air, Natural Gas
Cooling
- Wall/Window Unit(s)
Appliances
- Included: Disposal
- Laundry: Washer Hookup, Gas Dryer Hookup
Features
- Ceiling Fan(s), All Bedrooms Up
- Has fireplace: No
- Fireplace features: None
- Common walls with other units/homes: 1 Common Wall
Interior area
- Total interior livable area: 1,166 sqft
Property
Parking
- Total spaces: 2
- Parking features: Door-Multi, Garage
- Garage spaces: 2
Features
- Levels: Two
- Stories: 2
- Entry location: Front Door
- Patio & porch: Concrete, Patio
- Pool features: None
- Spa features: None
- Fencing: Block,Wood
Lot
- Size: 0.34 Acres
Details
- Parcel number: 6240005034
- Special conditions: Standard
Construction
Type & style
- Home type: Condo
- Property subtype: Condominium
- Attached to another structure: Yes
Materials
- Stucco
- Foundation: Slab
Condition
- New construction: No
- Year built: 1979
Utilities & green energy
- Sewer: Public Sewer
- Water: Public
Community & HOA
Community
- Features: Curbs, Sidewalks
Location
- Region: Paramount
Financial & listing details
- Price per square foot: $420/sqft
- Tax assessed value: $529,563
- Date on market: 9/19/2026
- Cumulative days on market: 44 days
- Listing terms: Cash to New Loan
Estimated market value
$485,000
$461,000 - $509,000
$2,723/mo
Price history
| Date | Event | Price |
|---|---|---|
| 9/20/2026 | Listed for sale | $489,900+58%$420/sqft |
Source:  CRMLS #DW26205117 Report a problem | ||
| 11/16/2017 | Listing removed | $310,000$266/sqft |
Source: ARREOLAS REALTY #MB17139062 Report a problem | ||
| 10/14/2017 | Listed for sale | $310,000$266/sqft |
Source: ARREOLAS REALTY #MB17139062 Report a problem | ||
| 8/17/2017 | Listing removed | $310,000$266/sqft |
Source: ARREOLAS REALTY #MB17139062 Report a problem | ||
| 7/2/2017 | Listed for sale | $310,000$266/sqft |
Source: ARREOLAS REALTY #MB17139062 Report a problem | ||
| 4/29/2017 | Listing removed | $310,000$266/sqft |
Source: ARREOLAS REALTY #MB16768136 Report a problem | ||
| 2/24/2017 | Price change | $310,000+3.3%$266/sqft |
Source: ARREOLAS REALTY #MB16768136 Report a problem | ||
| 12/28/2016 | Listed for sale | $300,000+192.7%$257/sqft |
Source: ARREOLAS REALTY #MB16768136 Report a problem | ||
| 2/9/2010 | Sold | $102,500-2.4%$88/sqft |
Source: Public Record Report a problem | ||
| 10/20/2009 | Sold | $105,000-69.4%$90/sqft |
Source: Public Record Report a problem | ||
| 1/8/2007 | Sold | $343,000+46%$294/sqft |
Source: Public Record Report a problem | ||
| 10/25/2004 | Sold | $235,000+175%$202/sqft |
Source: Public Record Report a problem | ||
| 6/26/1996 | Sold | $85,454+20.3%$73/sqft |
Source: Public Record Report a problem | ||
| 8/18/1995 | Sold | $71,056$61/sqft |
Source: Public Record Report a problem | ||
Public tax history
| Year | Property taxes | Tax assessment |
|---|---|---|
| 2026 | -- | $529,563 +2% |
| 2025 | $6,848 +55.1% | $519,180 +59.4% |
| 2024 | $4,415 +1.9% | $325,728 +2% |
| 2023 | $4,334 +2.8% | $319,342 +2% |
| 2022 | $4,218 +2.4% | $313,081 +2% |
| 2021 | $4,120 +2.3% | $306,943 +1% |
| 2020 | $4,028 | $303,796 +2% |
| 2019 | $4,028 +2.1% | $297,840 +2% |
| 2018 | $3,944 | $292,000 +156.1% |
| 2017 | $3,944 +125% | $113,998 +2% |
| 2016 | $1,753 +7.7% | $111,763 +1.5% |
| 2015 | $1,627 +2.9% | $110,085 +2% |
| 2014 | $1,581 | $107,929 +2.5% |
| 2012 | -- | $105,336 +2% |
| 2011 | -- | $103,271 -16.7% |
| 2010 | -- | $124,000 -27.7% |
| 2009 | -- | $171,400 -51% |
| 2008 | -- | $349,860 +43.1% |
| 2007 | -- | $244,493 +2% |
| 2006 | -- | $239,700 |
| 2005 | -- | $239,700 +145.7% |
| 2004 | -- | $97,556 +1.9% |
| 2003 | -- | $95,769 +2% |
| 2002 | -- | $93,892 +4% |
| 2000 | -- | $90,248 |
Find assessor info on the county website
Monthly payment
Est. payment
Payment breakdown
Explore the cost of this home by adjusting the details. Changes won't be saved.Climate risks
Neighborhood: 90723

Similar homes
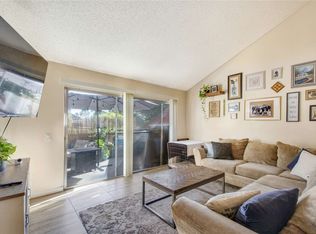
- $484,9992 bd2 ba1k sqft7304 Exeter St Unit E, Paramount, CA 90723For Sale
 MLS ID #CV26134444, Chasity Brugman, REALTY ONE GROUP MASTERS. CRMLS
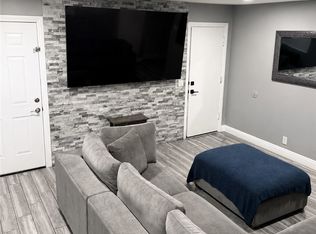
- $580,0003 bd2 ba1.4k sqft6733 Caro St #47, Paramount, CA 90723For Sale
 MLS ID #FR26229330, Brian Dombroski, Dombroski Realty. CRMLS
- $499,9992 bd2 ba986 sqft7258 Exeter St #6, Paramount, CA 90723For Sale
 MLS ID #IV26103796, GRISELDA TORRES, Realty One Group Empire. CRMLS
- $--2 bd3 ba940 sqft15351 Hunsaker Ave Unit E, Paramount, CA 90723Auction
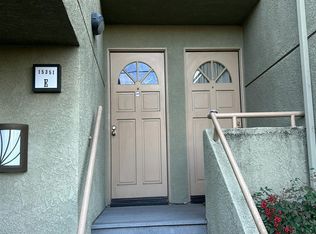 Auction.com 2
