This 1706 square foot single family home has 4 bedrooms and 2.0 bathrooms. This home is located at 7113 Carriage Dr, Citrus Heights, CA 95621.
Pre-foreclosure
Street View
Est. $473,300
7113 Carriage Dr, Citrus Heights, CA 95621
4beds
1,706sqft
SingleFamily
Built in 1958
6,534 Square Feet Lot
$473,300 Zestimate®
$277/sqft
$-- HOA
Overview
- 88 days
- 6
- 0
Facts & features
Interior
Bedrooms & bathrooms
- Bedrooms: 4
- Bathrooms: 2
- Full bathrooms: 2
Heating
- Other, Gas
Cooling
- Central
Appliances
- Included: Dishwasher, Microwave, Refrigerator
Features
- Flooring: Tile, Carpet, Laminate
- Has fireplace: Yes
Interior area
- Total interior livable area: 1,706 sqft
Property
Parking
- Parking features: Garage - Attached
Features
- Exterior features: Stucco
Lot
- Size: 6,534 Square Feet
Details
- Parcel number: 21103040040000
Construction
Type & style
- Home type: SingleFamily
Materials
- wood frame
- Roof: Composition
Condition
- Year built: 1958
Utilities & green energy
- Sewer: In & Connected
- Utilities for property: 220 Volts
Community & HOA
Location
- Region: Citrus Heights
Financial & listing details
- Price per square foot: $277/sqft
- Tax assessed value: $509,377
Foreclosure details
Estimated market value
$473,300
$450,000 - $497,000
$2,709/mo
Price history
| Date | Event | Price |
|---|---|---|
| 4/24/2023 | Sold | $480,000+0.2%$281/sqft |
Source: MetroList Services of CA #223017831 Report a problem | ||
| 3/31/2023 | Pending sale | $479,000$281/sqft |
Source: MetroList Services of CA #223017831 Report a problem | ||
| 3/15/2023 | Listed for sale | $479,000$281/sqft |
Source: MetroList Services of CA #223017831 Report a problem | ||
| 3/8/2023 | Pending sale | $479,000$281/sqft |
Source: MetroList Services of CA #223017831 Report a problem | ||
| 3/5/2023 | Listed for sale | $479,000+36.9%$281/sqft |
Source: MetroList Services of CA #223017831 Report a problem | ||
| 4/11/2018 | Listing removed | $349,900$205/sqft |
Source: CENTURY 21 Select Real Estate, Inc. #18006974 Report a problem | ||
| 4/3/2018 | Price change | $349,900-2.8%$205/sqft |
Source: CENTURY 21 Select Real Estate, Inc. #18006974 Report a problem | ||
| 3/7/2018 | Price change | $359,900-1.4%$211/sqft |
Source: CENTURY 21 Select Real Estate, Inc. #18006974 Report a problem | ||
| 3/1/2018 | Price change | $364,900-1.4%$214/sqft |
Source: CENTURY 21 Select Real Estate, Inc. #18006974 Report a problem | ||
| 2/8/2018 | Listed for sale | $369,900+22.5%$217/sqft |
Source: Century 21 Select Real Estate #18006974 Report a problem | ||
| 1/29/2016 | Sold | $302,000+11.9%$177/sqft |
Source: MetroList Services of CA #15072573 Report a problem | ||
| 7/31/2014 | Sold | $270,000+75.9%$158/sqft |
Source: MetroList Services of CA #14033170 Report a problem | ||
| 6/11/2013 | Sold | $153,500+9.6%$90/sqft |
Source: Public Record Report a problem | ||
| 2/1/2002 | Sold | $140,000+31.5%$82/sqft |
Source: MetroList Services of CA #152128012 Report a problem | ||
| 7/7/1995 | Sold | $106,434$62/sqft |
Source: Public Record Report a problem | ||
Public tax history
| Year | Property taxes | Tax assessment |
|---|---|---|
| 2026 | -- | $509,377 +2% |
| 2025 | $5,956 +0.9% | $499,390 +2% |
| 2024 | $5,900 +2.6% | $489,599 +42.5% |
| 2023 | $5,751 +40.2% | $343,618 +2% |
| 2022 | $4,103 +1.7% | $336,881 +2% |
| 2021 | $4,035 +1.9% | $330,277 +1% |
| 2020 | $3,960 +2% | $326,891 +2% |
| 2019 | $3,881 +1.2% | $320,483 +2% |
| 2018 | $3,836 +1% | $314,200 +2% |
| 2017 | $3,799 +17.8% | $308,040 +12.4% |
| 2016 | $3,224 +1.7% | $274,117 +1.5% |
| 2015 | $3,169 +123.8% | $270,000 +125.9% |
| 2014 | $1,416 | $119,539 -0.4% |
| 2013 | -- | $119,986 +14% |
| 2012 | -- | $105,252 -6% |
| 2011 | -- | $111,972 -8% |
| 2010 | -- | $121,710 -45.3% |
| 2008 | -- | $222,543 +2% |
| 2007 | -- | $218,180 +44.2% |
| 2006 | -- | $151,339 +2% |
| 2005 | -- | $148,373 +2% |
| 2004 | -- | $145,465 +1.9% |
| 2003 | -- | $142,800 +32.3% |
| 2002 | -- | $107,950 +2% |
| 2001 | -- | $105,834 +2% |
| 2000 | -- | $103,760 |
Find assessor info on the county website
Monthly payment
Climate risks
Neighborhood: Rusch Park
- $381,0003 bd1 ba1.2k sqft7107 Carriage Dr, Citrus Heights, CA 95621Off Market
- $543,6004 bd3 ba2.5k sqft7266 Midnight Way, Citrus Heights, CA 95621Off Market
- $456,2003 bd2 ba1.6k sqft7112 Glass Slipper Way, Citrus Heights, CA 95621Off Market
- $364,9003 bd1 ba1k sqft7260 Midnight Way, Citrus Heights, CA 95621Off Market

Similar homes
- $479,0003 bd2 ba1.6k sqft7241 Raintree Dr, Citrus Heights, CA 95621For Sale
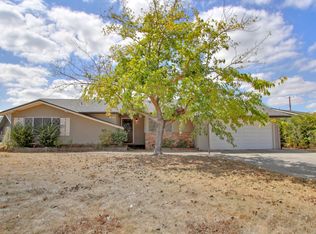 MLS ID #226116618, Paula Swayne. MetroList Services of CA
- $439,9903 bd2 ba1k sqft7905 Lesser Way, Citrus Heights, CA 95621For Sale
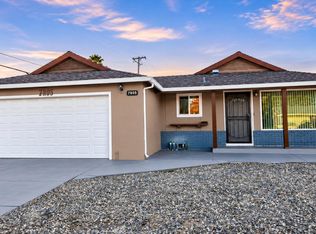 MLS ID #226136804, Rupinder Johl. MetroList Services of CA
- $398,0003 bd2 ba1.7k sqft6904 Winlock Ave, Citrus Heights, CA 95621For Sale
 MLS ID #226137115, Tanya Romanishin. MetroList Services of CA
- $475,0004 bd2 ba1.3k sqft7651 Gingerblossom Dr, Citrus Heights, CA 95621For Sale
 MLS ID #226092658, Tale'a Viscarra-Anderson. MetroList Services of CA
