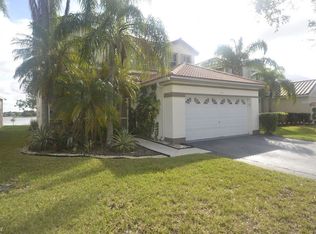
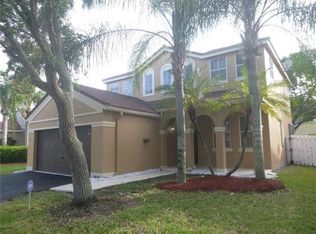
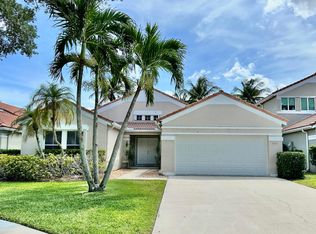
This 2022 square foot single family home has 4 bedrooms and 2.5 bathrooms. This home is located at 720 Falling Water Rd, Weston, FL 33326.
Pre-foreclosure
Est. $714,300
720 Falling Water Rd, Weston, FL 33326
4beds
2baths
2,022sqft
SingleFamily
Built in 1994
6,323 Square Feet Lot
$714,300 Zestimate®
$353/sqft
$88/mo HOA
Overview
- 95 days |
- 32 |
- 3 |
Facts & features
Interior
Bedrooms & bathrooms
- Bedrooms: 4
- Bathrooms: 2.5
Heating
- Forced air
Cooling
- Central
Appliances
- Included: Dishwasher, Dryer, Garbage disposal, Washer
- Laundry: In Unit
Features
- Flooring: Tile, Concrete
- Furnished: Yes
Interior area
- Total interior livable area: 2,022 sqft
Property
Parking
- Total spaces: 2
Features
- Exterior features: Stucco, Cement / Concrete
Lot
- Size: 6,323 Square Feet
Details
- Parcel number: 503901023360
Construction
Type & style
- Home type: SingleFamily
Materials
- masonry
- Foundation: Other
- Roof: Tile
Condition
- Year built: 1994
Community & HOA
HOA
- Has HOA: Yes
- HOA fee: $88 monthly
Location
- Region: Weston
Financial & listing details
- Price per square foot: $353/sqft
- Tax assessed value: $709,880
- Annual tax amount: $13,559
Visit our professional directory to find a foreclosure specialist in your area that can help with your home search.
Find a foreclosure agentForeclosure details
Estimated market value
$714,300
$671,000 - $757,000
$4,985/mo
Price history
| Date | Event | Price |
|---|---|---|
| 10/29/2025 | Listing removed | $4,500$2/sqft |
Source: | ||
| 9/24/2025 | Listed for rent | $4,500$2/sqft |
Source: | ||
| 9/23/2025 | Listing removed | $4,500$2/sqft |
Source: | ||
| 9/19/2025 | Price change | $4,500-6.3%$2/sqft |
Source: | ||
| 9/15/2025 | Price change | $4,800-4%$2/sqft |
Source: | ||
| 9/10/2025 | Price change | $5,000-3.8%$2/sqft |
Source: | ||
| 9/2/2025 | Price change | $5,200-1.9%$3/sqft |
Source: | ||
| 8/26/2025 | Price change | $5,300-1.9%$3/sqft |
Source: | ||
| 6/28/2025 | Price change | $5,400-1.8%$3/sqft |
Source: | ||
| 6/11/2025 | Listed for rent | $5,500+3.8%$3/sqft |
Source: | ||
| 5/22/2024 | Listing removed | -- |
Source: | ||
| 4/15/2024 | Price change | $5,300-3.6%$3/sqft |
Source: | ||
| 3/20/2024 | Listed for rent | $5,500+44.7%$3/sqft |
Source: | ||
| 6/24/2018 | Listing removed | $3,800$2/sqft |
Source: International Commercial Associates #A10280155 Report a problem | ||
| 6/9/2018 | Listed for rent | $3,800$2/sqft |
Source: International Commercial Associates #A10280155 Report a problem | ||
| 3/23/2018 | Listing removed | $3,800$2/sqft |
Source: RE/MAX Premier Associates #A10280155 Report a problem | ||
| 5/19/2017 | Listed for rent | $3,800$2/sqft |
Source: RE/MAX Premier Associates #A10280155 Report a problem | ||
| 3/14/2013 | Sold | $225,000-25%$111/sqft |
Source: Public Record Report a problem | ||
| 2/28/2013 | Listed for sale | $300,000$148/sqft |
Source: Re/Max Premier Associates #A1622374 Report a problem | ||
| 5/18/2012 | Listing removed | $300,000$148/sqft |
Source: RE/MAX PREMIER ASSOCIATES #A1622374 Report a problem | ||
| 3/30/2012 | Listed for sale | $300,000+29%$148/sqft |
Source: Re/Max Premier Associates #A1622374 Report a problem | ||
| 8/19/2002 | Sold | $232,500+40.5%$115/sqft |
Source: Public Record Report a problem | ||
| 10/30/1998 | Sold | $165,500+13.6%$82/sqft |
Source: Public Record Report a problem | ||
| 1/5/1994 | Sold | $145,700$72/sqft |
Source: Public Record Report a problem | ||
Public tax history
| Year | Property taxes | Tax assessment |
|---|---|---|
| 2025 | $13,559 +9.4% | $596,910 +10% |
| 2024 | $12,394 +7.5% | $542,650 +10% |
| 2023 | $11,525 +12.7% | $493,320 +10% |
| 2022 | $10,223 +10.8% | $448,480 +10% |
| 2021 | $9,228 +9.8% | $407,710 +10% |
| 2020 | $8,402 +4.9% | $370,650 +10% |
| 2019 | $8,010 | $336,960 -10.3% |
| 2018 | $8,010 +9.3% | $375,660 +34.9% |
| 2017 | $7,329 +9.8% | $278,490 +10% |
| 2016 | $6,675 +4.6% | $253,180 +10% |
| 2015 | $6,384 +3% | $230,170 +10% |
| 2014 | $6,198 +18.4% | $209,250 -21.1% |
| 2013 | $5,235 +6.1% | $265,100 +4% |
| 2012 | $4,932 +3.9% | $255,020 +4.9% |
| 2011 | $4,747 -1.9% | $243,040 +6.9% |
| 2010 | $4,841 -9.5% | $227,370 -14.6% |
| 2009 | $5,346 -0.7% | $266,360 -2.1% |
| 2008 | $5,383 +2.2% | $271,990 +3% |
| 2007 | $5,268 +0.4% | $264,070 +2.5% |
| 2006 | $5,247 | $257,630 +3% |
| 2005 | -- | $250,130 +3% |
| 2004 | $5,501 +1.9% | $242,850 +14.7% |
| 2003 | $5,397 +49.1% | $211,710 +43% |
| 2002 | $3,620 +3.4% | $148,050 +1.6% |
| 2001 | $3,503 +3.7% | $145,720 |
| 2000 | $3,377 | -- |
Find assessor info on the county website
Monthly payment
Climate risks
Neighborhood: North Lake
Nearby schools
GreatSchools rating
- 10/10Eagle Point Elementary SchoolGrades: PK-5Distance: 0.3 mi
- 9/10Tequesta Trace Middle SchoolGrades: 6-8Distance: 1.7 mi
- 8/10Cypress Bay High SchoolGrades: 9-12Distance: 4.5 mi
Schools provided by the listing agent
- Elementary: Eagle Point
- High: Cypress Bay
- District: BROWARD
Source: The MLS. This data may not be complete. We recommend contacting the local school district to confirm school assignments for this home.
- $831,1004 bd2 ba2.6k sqft710 Falling Water Rd, Weston, FL 33326Off Market
- $752,4004 bd3 ba2k sqft810 Falling Water Rd #0, Weston, FL 33326Off Market
- $777,1004 bd2 ba1.9k sqft745 Falling Water Rd, Weston, FL 33326Off Market
- $633,8003 bd2 ba2k sqft740 Falling Water Rd, Fort Lauderdale, FL 33326Off Market
- $674,7003 bd2 ba2k sqft750 Falling Water Rd, Weston, FL 33326Off Market
- $633,4003 bd2 ba1.9k sqft735 Falling Water Rd, Weston, FL 33326Off Market
- $621,7003 bd2 ba1.4k sqft700 Falling Water Rd, Weston, FL 33326Off Market
- $637,9003 bd2 ba1.5k sqft755 Falling Water Rd, Fort Lauderdale, FL 33326Off Market
Similar homes
- $790,0004 bd2 ba2k sqft386 Carrington Drive, Weston, FL 33326For Sale
 MLS ID #B26025229, Maria L Costoya, Vista Mar Realty Group Inc.. BeachesMLS
 - $699,9004 bd4 ba2.2k sqftBonaventure Lakes Add 2, Weston, FL 33326For Sale

 MLS ID #A12051966, Zhen Chen, United Realty Group Inc. MIAMI
 - $780,0003 bd3 ba1.8k sqftNorth Lakes, Weston, FL 33326For Sale
 MLS ID #A12031380, Erika Nunez-Melgar PA, Coldwell Banker Realty. MIAMI
 - $759,0004 bd3 ba2k sqft16751 Redwood Way, Weston, FL 33326For Sale
 MLS ID #B26044311, Lori Bellomio Jacobs, Charles Rutenberg Realty FTL. BeachesMLS
 - $720,0004 bd2 ba1.9k sqftBonavillas, Weston, FL 33326For SaleMLS ID #A11985825, Agustin Coll, Lifestyle International Realty. MIAMI
- $749,9994 bd3 ba1.8k sqftBonaventure Lakes Add 2, Weston, FL 33326For SaleMLS ID #A11997395, Maryorie Martinez, M & M Realty Investors, LLC. MIAMI
- $919,0004 bd2 ba2.2k sqft804 Heritage Drive, Weston, FL 33326For SaleMLS ID #B26028308, Phyllis M Scarberry, Berkshire Hathaway HomeService. BeachesMLS
- $719,9994 bd3 ba2.1k sqftSector 3 - Parcels C D E, Weston, FL 33327For SaleMLS ID #A12003508, Luis Gonzalez LLC, Coldwell Banker Realty. MIAMI
- $740,0003 bd2 ba1.3k sqftSector 5 -, Weston, FL 33326For SaleMLS ID #A12056338, Ricky Kallabat PA, Keller Williams Capital Realty. MIAMI
- $660,0003 bd2 ba1.5k sqftSectors 3 & 4 Boundary Pl, Weston, FL 33326For SaleMLS ID #A12005149, Luis Cabrera, Eagle Homes Realty, Inc.. MIAMI
- $695,0003 bd2 ba1.5k sqftThe Lakes, Fort Lauderdale, FL 33326For SaleMLS ID #A12040012, Erika Nunez-Melgar PA, Coldwell Banker Realty. MIAMI
- $--4 bd3 ba2.6k sqft608 Cascade Falls Dr #D, Fort Lauderdale, FL 33327AuctionAuction.com 2
- $758,7003 bd2 ba1.7k sqftSector 5 Parcel 23, Fort Lauderdale, FL 33326For SaleMLS ID #A12029430, Karina Meza, Oceanica International Realty. MIAMI
- $839,9004 bd2 ba2k sqft501 SW 168th Way, Weston, FL 33326For SaleMLS ID #B26055247, Maria Carlton, RE Florida Homes. BeachesMLS
- $725,0003 bd3 ba1.9k sqftSector 6, Weston, FL 33326For SaleMLS ID #A12049905, Matthew Jerry, Coldwell Banker Realty. MIAMI
- $874,8745 bd4 ba2.3k sqft873 Stanton Drive, Weston, FL 33326For SaleMLS ID #B26006677, Oscar Correa, Coldwell Banker Realty. BeachesMLS
- $817,0004 bd3 ba2.4k sqft1428 CANARY ISLAND Drive, Weston, FL 33327For SaleMLS ID #B26058913, Chin H Morales, London Foster Realty. BeachesMLS
- $875,0004 bd3 ba2.1k sqft52 Gables Boulevard, Weston, FL 33326For SaleMLS ID #B26043869, Miata Waldo, Charles Rutenberg Realty FTL. BeachesMLS
- $679,5003 bd2 ba1.3k sqftSector 5 -, Weston, FL 33326For SaleMLS ID #A12048109, Ender Urdaneta, Canvas Real Estate. MIAMI
- $859,9004 bd3 ba2.4k sqftSector 2-Parcels 21a 25 2, Weston, FL 33327For SaleMLS ID #A12063387, Gina Costa, Related General Realty, LLC.. MIAMI
