It was in there once, so I made it more prominent: it's now in the headline, the opening line, and the closing.
**Sold As-Is Investor Opportunity in Compton: Fix & Flip or Buy & Hold**
SOLD AS-IS. Bring your contractor and your vision. 727 W Cherry St is a value-add property priced for investors, with heavy rehab needed and real upside after renovation. Seller will make no repairs, credits, or warranties.
Sitting on a [lot size] lot in the heart of Compton, this [beds]-bed, [baths]-bath, [sq ft] sq ft home offers a great layout to rework. The property needs a full renovation, so buyers should expect work on [roof, plumbing, electrical, kitchen, baths, flooring, etc.].
**Why investors will like it:**
- Strong rehab margin for a renovate-and-resell strategy
- Hold it as a rental in a high-demand Los Angeles County market
- Possible room to add value with [ADU potential, if verified with the city]
- Priced below renovated comps in the area
Cash or hard money preferred. Proof of funds required before showings. Property is sold as-is, where-is. Buyer to verify all details, permits, and square footage independently.
Serious investors only. Message to schedule a walkthrough.
For sale by owner
$520,000
727 W Cherry St, Compton, CA 90222
3beds
1,119sqft
SingleFamily
Built in 1938
4,791 Square Feet Lot
$604,400 Zestimate®
$465/sqft
$-- HOA
What's special
Great layoutLot size
- 8 days
- 858
- 25
Listed by:
Property Owner (424) 284-1847
Facts & features
Interior
Bedrooms & bathrooms
- Bedrooms: 3
- Bathrooms: 2
- Full bathrooms: 2
Heating
- Wall
Features
- Has fireplace: No
Interior area
- Total interior livable area: 1,119 sqft
Property
Lot
- Size: 4,791 Square Feet
Details
- Parcel number: 6153003015
Construction
Type & style
- Home type: SingleFamily
Condition
- New construction: No
- Year built: 1938
Community & HOA
Location
- Region: Compton
Financial & listing details
- Price per square foot: $465/sqft
- Tax assessed value: $143,732
- Date on market: 11/10/2026
Estimated market value
$604,400
$562,000 - $641,000
$3,312/mo
Price history
| Date | Event | Price |
|---|---|---|
| 11/10/2026 | Listed for sale | $520,000+519%$465/sqft |
Source: Owner Report a problem | ||
| 12/29/2008 | Sold | $84,000-60.7%$75/sqft |
Source: Public Record Report a problem | ||
| 10/16/2008 | Price change | $214,000-8.1%$191/sqft |
Source: Listhub #P658952 Report a problem | ||
| 8/30/2008 | Price change | $232,900-3.8%$208/sqft |
Source: Listhub #P641126 Report a problem | ||
| 8/23/2008 | Listed for sale | $242,000-9.6%$216/sqft |
Source: Listhub #P641126 Report a problem | ||
| 12/5/2007 | Sold | $267,840-30.4%$239/sqft |
Source: Public Record Report a problem | ||
| 11/7/2006 | Sold | $385,000+18.5%$344/sqft |
Source: Public Record Report a problem | ||
| 5/18/2005 | Sold | $325,000+75.7%$290/sqft |
Source: Public Record Report a problem | ||
| 12/6/2002 | Sold | $185,000+63.7%$165/sqft |
Source: Public Record Report a problem | ||
| 9/3/2002 | Sold | $113,000-16%$101/sqft |
Source: Public Record Report a problem | ||
| 2/25/2002 | Sold | $134,550+3.9%$120/sqft |
Source: Public Record Report a problem | ||
| 3/3/1997 | Sold | $129,500+50.6%$116/sqft |
Source: Public Record Report a problem | ||
| 12/20/1996 | Sold | $86,000-19.2%$77/sqft |
Source: Public Record Report a problem | ||
| 2/22/1996 | Sold | $106,471$95/sqft |
Source: Public Record Report a problem | ||
Public tax history
| Year | Property taxes | Tax assessment |
|---|---|---|
| 2026 | -- | $143,732 +2% |
| 2025 | $3,213 +0.5% | $140,915 +2% |
| 2024 | $3,196 +1.5% | $138,153 +2% |
| 2023 | $3,150 +17.7% | $135,445 +2% |
| 2022 | $2,676 -0.7% | $132,790 +2% |
| 2021 | $2,694 +1.6% | $130,188 +1% |
| 2020 | $2,653 | $128,854 +2% |
| 2019 | $2,653 +6.1% | $126,329 +2% |
| 2018 | $2,501 | $123,853 +2% |
| 2017 | $2,501 +2.6% | $121,425 +2% |
| 2016 | $2,439 +2.4% | $119,045 +1.5% |
| 2015 | $2,382 +5.8% | $117,258 +2% |
| 2014 | $2,252 | $114,962 +2.5% |
| 2012 | -- | $112,200 +2% |
| 2011 | -- | $110,000 -22% |
| 2010 | -- | $141,000 -11.9% |
| 2009 | -- | $160,000 -56.8% |
| 2008 | -- | $370,000 -3.9% |
| 2007 | -- | $385,000 +15.1% |
| 2006 | -- | $334,560 |
| 2005 | -- | $334,560 +77.5% |
| 2004 | -- | $188,453 +1.9% |
| 2003 | -- | $185,000 +29.6% |
| 2002 | -- | $142,769 +4% |
| 2000 | -- | $137,227 |
Find assessor info on the county website
Monthly payment
Est. payment
Payment breakdown
Explore the cost of this home by adjusting the details. Changes won't be saved.Climate risks
Neighborhood: 90222

Similar homes
- $499,9004 bd2 ba828 sqft13121 S Penrose Ave, Compton, CA 90222For Sale
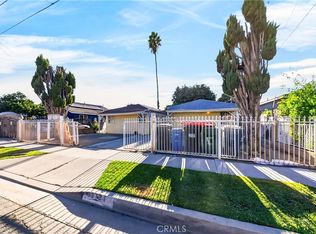 MLS ID #PV26230403, Rita DeBolt, The Real Estate Group. CRMLS
- $499,0003 bd2 ba828 sqft13123 S Penrose Ave, Compton, CA 90222For Sale
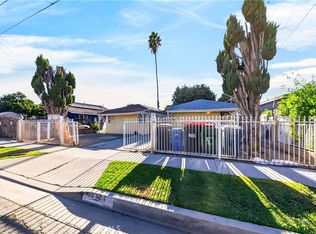 MLS ID #PV26167914, Rita DeBolt, The Real Estate Group. CRMLS
- $550,0002 bd1 ba822 sqft2107 N Anzac Ave, Compton, CA 90222For Sale
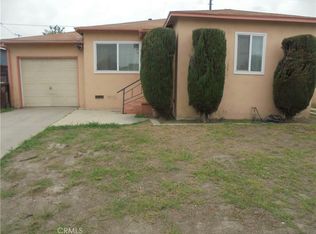 MLS ID #PW26230163, Beverly Marks, Coldwell Banker Envision. CRMLS
- $595,0003 bd2 ba1.1k sqft815 W 134th St, Compton, CA 90222For Sale
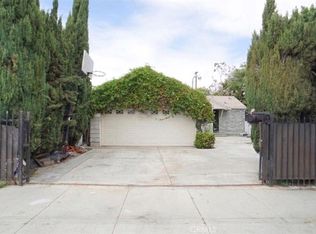 MLS ID #DW26211520, Anna Escareno, Anna Escareno, Broker. CRMLS
Local buyer's agents are ready to help
