73-75 Melrose Street is a clean, well-kept multifamily offering 6 bedrooms, 2 full bathrooms, and 2, 120 sq ft of living space. Both units have practical layouts with good-sized rooms, plus basement storage and a private yard on a 5, 001 sq ft lot. A strong Springfield opportunity with space, flexibility, and a convenient location near everyday amenities and major routes.
Pending
$375,000
73-75 Melrose St, Springfield, MA 01109
6beds
2,120sqft
Multi Family
Built in 1925
-- sqft lot
$365,500 Zestimate®
$177/sqft
$-- HOA
What's special
- 65 days
- 8
- 0
Zillow last checked:
Listed by:
Team Elite,
NextHome Elite Realty
Source: NextHome,MLS#: 73567119
Facts & features
Interior
Bedrooms & bathrooms
- Bedrooms: 6
- Bathrooms: 2
- Full bathrooms: 2
Features
- Has basement: No
Interior area
- Total structure area: 2,120
- Total interior livable area: 2,120 sqft
Property
Lot
- Size: 4,791 Square Feet
Details
- Parcel number: SPRIS08520P0026
Construction
Type & style
- Home type: MultiFamily
- Property subtype: Multi Family
Condition
- Year built: 1925
Community & HOA
Location
- Region: Springfield
Financial & listing details
- Price per square foot: $177/sqft
- Tax assessed value: $198,300
- Annual tax amount: $3,109
- Date on market: 8/23/2026
- Lease term: Contact For Details
Estimated market value
$365,500
$347,000 - $384,000
$1,928/mo
Price history
| Date | Event | Price |
|---|---|---|
| 9/4/2026 | Pending sale | $375,000$177/sqft |
Source:  NextHome #73567119 Report a problem | ||
| 8/26/2026 | Listed for sale | $375,000+87.5%$177/sqft |
Source: NextHome #73567119 Report a problem | ||
| 10/20/2023 | Sold | $200,000$94/sqft |
Source: Public Record Report a problem | ||
Public tax history
| Year | Property taxes | Tax assessment |
|---|---|---|
| 2025 | $3,109 +16.3% | $198,300 +19.1% |
| 2024 | $2,674 -16.4% | $166,500 -11.2% |
| 2023 | $3,197 +20.8% | $187,500 +33.4% |
| 2022 | $2,646 +1.7% | $140,600 +2.2% |
| 2021 | $2,601 -6.4% | $137,600 -3.3% |
| 2020 | $2,779 +23.3% | $142,300 +24.3% |
| 2019 | $2,253 +15.7% | $114,500 +15.7% |
| 2018 | $1,948 -2.6% | $99,000 -2.7% |
| 2017 | $1,999 +17.8% | $101,700 +17.8% |
| 2016 | $1,697 +8.4% | $86,300 +8.4% |
| 2015 | $1,566 -1.8% | $79,600 -1.6% |
| 2014 | $1,595 +14.2% | $80,900 +14.1% |
| 2013 | $1,397 +63% | $70,900 +64.1% |
| 2012 | $857 -52% | $43,200 -52.8% |
| 2011 | $1,785 -9.2% | $91,600 -9.1% |
| 2010 | $1,966 -7.6% | $100,800 -15.2% |
| 2009 | $2,127 +49.3% | $118,900 +33.7% |
| 2008 | $1,425 +3.3% | $88,900 +3.4% |
| 2007 | $1,379 +61.9% | $86,000 +71.7% |
| 2006 | $852 +34% | $50,100 +38% |
| 2005 | $636 -46.2% | $36,300 -41.7% |
| 2004 | $1,183 +6% | $62,300 +8.3% |
| 2003 | $1,116 +4.3% | $57,500 +6.9% |
| 2002 | $1,070 | $53,800 |
Find assessor info on the county website
Monthly payment
Est. payment
Payment breakdown
Explore the cost of this home by adjusting the details. Changes won't be saved.Climate risks
Neighborhood: Old Hill

Similar homes
- $375,0006 bd2 ba2.4k sqft162 Northampton Ave, Springfield, MA 01109For Sale
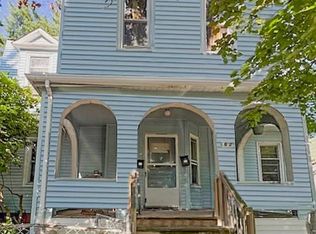 MLS ID #73555117, Rodney Villette, RE/MAX Synergy. MLS PIN
- $420,0006 bd2 ba1.9k sqft10 Monroe St, Springfield, MA 01109For Sale
 MLS ID #73548440, Nicole Flamand, Real Broker MA, LLC. MLS PIN
- $384,9996 bd2 ba2.7k sqft62-64 Alderman St, Springfield, MA 01108For Sale
 MLS ID #73576776, Alessio Calabrese, Lock and Key Realty Inc.. MLS PIN
- $359,9004 bd2 ba1.9k sqft31 Burton St, Springfield, MA 01108For Sale
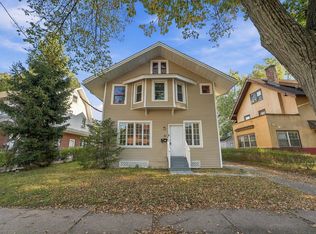 MLS ID #73595133, Kelley & Katzer Team, Kelley & Katzer Real Estate, LLC. MLS PIN
