$447,900
4 bd|2 ba|1.2k sqft
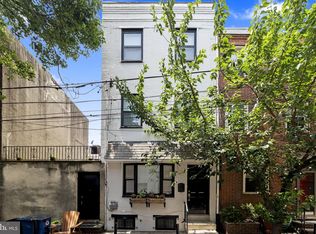
735 Ellsworth St, Philadelphia, PA 19147
Off Market
Zillow last checked:
Listing updated:
Jaime Hyman 610-613-1297,
Compass RE 2674358015
$591,200
$562,000 - $621,000
$2,966/mo
| Date | Event | Price |
|---|---|---|
| 6/8/2026 | Pending sale | $599,000+31.6%$416/sqft |
Source: | ||
| 7/10/2020 | Sold | $455,000-4.2%$316/sqft |
Source: Public Record Report a problem | ||
| 6/10/2020 | Pending sale | $475,000$330/sqft |
Source: RE/MAX One Realty #PAPH878116 Report a problem | ||
| 3/5/2020 | Listed for sale | $475,000+44.4%$330/sqft |
Source: RE/MAX One Realty #PAPH878116 Report a problem | ||
| 3/28/2016 | Listing removed | $2,395$2/sqft |
Source: RE/MAX Home Experts Report a problem | ||
| 3/12/2016 | Listed for rent | $2,395+9.1%$2/sqft |
Source: RE/MAX Home Experts Report a problem | ||
| 4/8/2014 | Listing removed | $2,195$2/sqft |
Source: RE/MAX Home Experts #6341318 Report a problem | ||
| 3/20/2014 | Price change | $2,195-4.4%$2/sqft |
Source: RE/MAX HOME EXPERTS #6341318 Report a problem | ||
| 3/12/2014 | Price change | $2,295-4.2%$2/sqft |
Source: RE/MAX HOME EXPERTS #6341318 Report a problem | ||
| 2/22/2014 | Listed for rent | $2,395$2/sqft |
Source: RE/MAX HOME EXPERTS #6341318 Report a problem | ||
| 5/30/2013 | Sold | $329,000$228/sqft |
Source: Public Record Report a problem | ||
| 4/6/2013 | Listed for sale | $329,000+5.5%$228/sqft |
Source: Prudential Fox and Roach #6196197 Report a problem | ||
| 4/12/2012 | Sold | $311,850-2.2%$217/sqft |
Source: Public Record Report a problem | ||
| 1/13/2012 | Listed for sale | $319,000+811.4%$222/sqft |
Source: ALPHA REALTY GROUP INC #5991037 Report a problem | ||
| 4/5/2000 | Sold | $35,000$24/sqft |
Source: Public Record Report a problem | ||
| Year | Property taxes | Tax assessment |
|---|---|---|
| 2025 | $6,804 +7.3% | $486,100 +7.3% |
| 2024 | $6,342 | $453,100 |
| 2023 | $6,342 -2.2% | $453,100 |
| 2022 | $6,482 | -- |
| 2021 | $6,482 +8.4% | -- |
| 2018 | $5,981 | -- |
| 2017 | $5,981 +85.1% | -- |
| 2016 | $3,232 | -- |
| 2015 | $3,232 | -- |
| 2014 | $3,232 +4.5% | $230,900 +1764.5% |
| 2012 | $3,094 | $12,384 |
| 2011 | -- | $12,384 |
| 2010 | -- | $12,384 |
| 2009 | -- | $12,384 |
| 2008 | -- | $12,384 |
| 2007 | -- | $12,384 +7.5% |
| 2006 | -- | $11,520 |
| 2005 | -- | $11,520 |
| 2004 | -- | $11,520 +7.5% |
| 2003 | -- | $10,720 |
| 2002 | -- | $10,720 +15.5% |
| 2000 | -- | $9,280 +1.8% |
| 1999 | -- | $9,120 |
Find assessor info on the county website
Source: Bright MLS. This data may not be complete. We recommend contacting the local school district to confirm school assignments for this home.
A local agent can set up tours, give advice and negotiate with sellers.