$256,500
3 bd1 ba1.1k sqft
7336 Winthrop Way UNIT 4, Downers Grove, IL 60516
Off Market
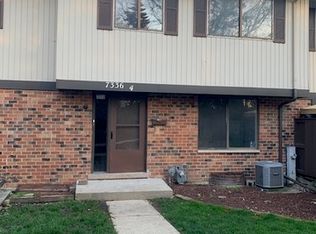
Listing description withheld by the listing agent.
Likely to sell faster than
Zillow last checked:
Listing updated:
Whitney Caruso 630-333-3480,
Nest Equity Realty

Not available
Estimated sales range
Not available
Not available
| Date | Event | Price |
|---|---|---|
| 12/21/2021 | Sold | $180,000+0.1%$156/sqft |
Source:  MRED as distributed by MLS GRID #11264004 Report a problem | ||
| 11/20/2021 | Contingent | $179,872$156/sqft |
Source: MRED as distributed by MLS GRID #11264004 Report a problem | ||
| 11/10/2021 | Price change | $179,872-2.7%$156/sqft |
Source: MRED as distributed by MLS GRID #11264004 Report a problem | ||
| 11/5/2021 | Listed for sale | $184,872+105.4%$160/sqft |
Source: MRED as distributed by MLS GRID #11264004 Report a problem | ||
| 1/8/2011 | Sold | $90,000-0.3%$78/sqft |
Source: MRED as distributed by MLS GRID #07608797 Report a problem | ||
| 1/8/2011 | Listed for sale | $90,250$78/sqft |
Source: RE/MAX Enterprises #07608797 Report a problem | ||
| 12/3/2010 | Listing removed | $90,250$78/sqft |
Source: foreclosure.com Report a problem | ||
| 9/16/2010 | Price change | $90,250-5%$78/sqft |
Source: foreclosure.com Report a problem | ||
| 8/14/2010 | Listed for sale | $95,000-47.8%$82/sqft |
Source: foreclosure.com Report a problem | ||
| 2/21/2006 | Sold | $182,000+23.8%$157/sqft |
Source: Public Record Report a problem | ||
| 1/24/2005 | Sold | $147,000+17.6%$127/sqft |
Source: Public Record Report a problem | ||
| 9/13/2002 | Sold | $125,000$108/sqft |
Source: Public Record Report a problem | ||
| Year | Property taxes | Tax assessment |
|---|---|---|
| 2025 | $3,548 +4.9% | $65,964 +7.9% |
| 2024 | $3,381 +5.4% | $61,135 +8.8% |
| 2023 | $3,206 +10.1% | $56,200 +12.1% |
| 2022 | $2,913 +3% | $50,130 +1.2% |
| 2021 | $2,828 +1.9% | $49,560 +2% |
| 2020 | $2,775 +3.6% | $48,570 |
| 2019 | $2,680 +14.3% | -- |
| 2018 | $2,344 +3.4% | $40,710 +3.9% |
| 2017 | $2,267 +17.5% | $39,170 +17.1% |
| 2016 | $1,928 +2.5% | $33,450 +6.3% |
| 2015 | $1,882 +10.6% | $31,470 +10.1% |
| 2014 | $1,701 -21.7% | $28,590 -19.6% |
| 2013 | $2,173 +1.8% | $35,570 -4.3% |
| 2012 | $2,134 -3.5% | $37,170 -15.5% |
| 2011 | $2,210 -11.4% | $43,970 -16.1% |
| 2010 | $2,495 +2.2% | $52,420 -5.8% |
| 2009 | $2,441 +0.9% | $55,640 |
| 2008 | $2,418 +2.8% | $55,640 +4.5% |
| 2007 | $2,352 +3.4% | $53,230 +7% |
| 2006 | $2,276 +4% | $49,750 +7.7% |
| 2005 | $2,188 +9.4% | $46,190 +12.3% |
| 2004 | $2,000 +0.8% | $41,120 +10% |
| 2003 | $1,984 +4.6% | $37,380 +7.8% |
| 2002 | $1,897 +2.8% | $34,680 +6.8% |
| 2001 | $1,846 +2.6% | $32,480 +3.5% |
| 2000 | $1,800 | $31,380 |
Source: MRED as distributed by MLS GRID. This data may not be complete. We recommend contacting the local school district to confirm school assignments for this home.

A local agent can set up tours, give advice and negotiate with sellers.
A local lender can help you make sure your offer is ready when you are.