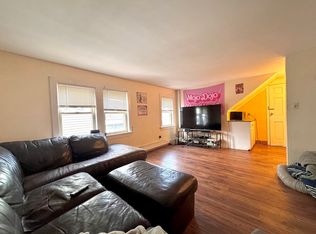
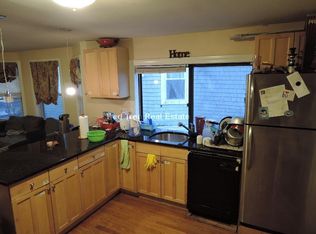
**The closest house to Boston University on Ashford Street!** This exceptionally well-located investment property has delivered 0% vacancy since its purchase more than 15 years ago, demonstrating the strength and consistency of the BU student rental market. Approximately 4,000 SF of living space plus a ** fully finished basement **, the property offers an updated, investor-friendly layout with modern kitchens and bathrooms and an open-concept kitchen/living area that continues to appeal to the highly sought-after student rental demographic. Just seconds from BU and within approximately 200 yards of restaurants, supermarkets, nightlife, and everyday conveniences, the location supports strong annual rental demand with the highly desirable September 1st leasing cycle. With the Rail Line redevelopment behind Pratt Street underway, this already premier location is positioned to benefit from continued investment and increased demand in the surrounding area. A compelling opportunity for investors seeking a proven rental property in one of Boston's most consistently desirable student housing markets.
Under contract
$1,850,000
74 Ashford St, Allston, MA 02134
13beds
3,986sqft
Multi Family
Built in 1920
-- sqft lot
$1,867,100 Zestimate®
$464/sqft
$-- HOA
What's special
Fully finished basementModern kitchens and bathroomsUpdated investor-friendly layout
- 44 days
- 180
- 11
Zillow last checked:
Listing updated:
Listed by:
AD Advisors Team 617-869-4907,
Block Realty 617-505-3324
Source: MLS PIN,MLS#: 73580678
Facts & features
Interior
Bedrooms & bathrooms
- Bedrooms: 13
- Bathrooms: 6
- Full bathrooms: 6
Features
- Flooring: Hardwood
- Windows: Insulated Windows
- Basement: Finished
- Has fireplace: No
Interior area
- Total structure area: 3,986
- Total interior livable area: 3,986 sqft
- Finished area above ground: 3,986
Video & virtual tour
Property
Parking
- Total spaces: 1
- Parking features: Paved Drive, Off Street
- Uncovered spaces: 1
Features
- Patio & porch: Deck, Patio
Lot
- Size: 4,000 Square Feet
- Features: Level
Details
- Parcel number: W:21 P:00418 S:000,1207062
- Zoning: R2
Construction
Type & style
- Home type: MultiFamily
- Property subtype: Multi Family
Materials
- Frame
- Foundation: Stone
- Roof: Shingle
Condition
- Year built: 1920
Utilities & green energy
- Electric: 200+ Amp Service
- Sewer: Public Sewer
- Water: Public
- Utilities for property: for Gas Range
Community & HOA
Community
- Features: Public Transportation, Shopping, Pool, Park, Walk/Jog Trails, Medical Facility, Laundromat, Bike Path, Conservation Area, Highway Access, House of Worship, Private School, Public School, T-Station, University, Other
Location
- Region: Allston
Financial & listing details
- Price per square foot: $464/sqft
- Tax assessed value: $1,859,200
- Annual tax amount: $23,054
- Date on market: 9/30/2026
- Total actual rent: 12800
- Road surface type: Paved
Estimated market value
$1,867,100
$1.66M - $2.09M
$4,856/mo
Price history
| Date | Event | Price |
|---|---|---|
| 11/2/2026 | Contingent | $1,850,000$464/sqft |
Source: MLS PIN #73580678 Report a problem | ||
| 9/30/2026 | Listed for sale | $1,850,000+92.7%$464/sqft |
Source: MLS PIN #73580678 Report a problem | ||
| 4/17/2024 | Listing removed | -- |
Source: Zillow Rentals Report a problem | ||
| 3/19/2024 | Listed for rent | $3,400-56.4%$1/sqft |
Source: Zillow Rentals Report a problem | ||
| 1/2/2024 | Listing removed | -- |
Source: Zillow Rentals Report a problem | ||
| 12/4/2023 | Listed for rent | $7,800+59.2%$2/sqft |
Source: Zillow Rentals Report a problem | ||
| 5/19/2023 | Listing removed | -- |
Source: Zillow Rentals Report a problem | ||
| 2/2/2023 | Price change | $4,900-35.5%$1/sqft |
Source: Zillow Rentals Report a problem | ||
| 1/27/2023 | Price change | $7,600+55.1%$2/sqft |
Source: Zillow Rentals Report a problem | ||
| 1/18/2023 | Price change | $4,900-35.5%$1/sqft |
Source: Zillow Rentals Report a problem | ||
| 12/4/2022 | Listed for rent | $7,600+61.7%$2/sqft |
Source: Zillow Rental Manager Report a problem | ||
| 5/1/2020 | Listing removed | $4,700$1/sqft |
Source: BU Off-Campus Cribs Report a problem | ||
| 3/17/2020 | Listed for rent | $4,700-39.4%$1/sqft |
Source: BU Off-Campus Cribs Report a problem | ||
| 1/29/2020 | Listing removed | $7,750$2/sqft |
Source: Kassis Group Design and Development Report a problem | ||
| 1/25/2020 | Listed for rent | $7,750+10.7%$2/sqft |
Source: Kassis Group Design and Development Report a problem | ||
| 5/14/2019 | Listing removed | $7,000$2/sqft |
Source: Marc Roos Realty Report a problem | ||
| 11/28/2018 | Listed for rent | $7,000+72.8%$2/sqft |
Source: James Kopecky Report a problem | ||
| 1/8/2018 | Listing removed | $4,050+9.5%$1/sqft |
Source: Zillow Rental Manager Report a problem | ||
| 11/28/2017 | Listed for rent | $3,700-15.9%$1/sqft |
Source: Gateway Real Estate Group Report a problem | ||
| 9/20/2017 | Listing removed | $4,400$1/sqft |
Source: preview Boston realty . Report a problem | ||
| 1/27/2017 | Price change | $4,400+22.2%$1/sqft |
Source: Luna Real Estate Report a problem | ||
| 1/14/2017 | Listed for rent | $3,600-18.2%$1/sqft |
Source: Zillow Rental Manager Report a problem | ||
| 5/27/2016 | Listing removed | $4,400$1/sqft |
Source: Red Tree Real Estate Report a problem | ||
| 1/8/2016 | Price change | $4,400-35.3%$1/sqft |
Source: Red Tree Real Estate Report a problem | ||
| 12/8/2015 | Listed for rent | $6,800$2/sqft |
Source: Red Tree Real Estate Report a problem | ||
| 5/26/2009 | Sold | $960,000+25.5%$241/sqft |
Source: Public Record Report a problem | ||
| 10/1/2004 | Sold | $765,000+1600%$192/sqft |
Source: Public Record Report a problem | ||
| 7/7/1989 | Sold | $45,000$11/sqft |
Source: Public Record Report a problem | ||
Public tax history
| Year | Property taxes | Tax assessment |
|---|---|---|
| 2025 | $20,495 +9% | $1,769,900 +2.6% |
| 2024 | $18,795 +1.5% | $1,724,300 |
| 2023 | $18,519 +8.6% | $1,724,300 +10% |
| 2022 | $17,054 +2% | $1,567,500 |
| 2021 | $16,725 +6% | $1,567,500 +4.9% |
| 2020 | $15,781 +3.2% | $1,494,400 +3% |
| 2019 | $15,292 +6.6% | $1,450,900 +6% |
| 2018 | $14,343 +389.5% | $1,368,600 +12.7% |
| 2017 | $2,930 -75% | $1,214,700 +14% |
| 2016 | $11,721 -5% | $1,065,500 +4.6% |
| 2015 | $12,340 +14% | $1,019,000 +23.7% |
| 2013 | $10,829 +3.8% | $824,100 +3% |
| 2012 | $10,433 +4% | $800,100 +2% |
| 2011 | $10,031 +6.6% | $784,300 -1% |
| 2010 | $9,411 +34.5% | $792,200 +20.3% |
| 2009 | $6,998 -7.8% | $658,300 -4.8% |
| 2008 | $7,588 -4.2% | $691,700 -4% |
| 2007 | $7,918 | $720,500 |
Find assessor info on the county website
Monthly payment
Est. payment
Payment breakdown
Explore the cost of this home by adjusting the details. Changes won't be saved.Climate risks
Neighborhood: Allston


Similar homes
- $1,998,00012 bd5 ba4.6k sqft6-8 Imrie Rd, Allston, MA 02134For Sale
 MLS ID #73571383, Victor Lu, V & E Realty. MLS PIN
- $1,565,00010 bd3 ba3.7k sqft251 Cambridge St, Allston, MA 02134For Sale
 MLS ID #73509786, Sean Rose, City Realty Group. MLS PIN
- $2,299,00011 bd4 ba3.2k sqft24 Farrington Ave, Allston, MA 02134For Sale
 MLS ID #73592017, Connor Nelson, Jacob Realty, LLC. MLS PIN
- $1,999,99911 bd3 ba4k sqft110 Murdock St, Boston, MA 02135For Sale
 MLS ID #73581591, CJ Lee, Redfin Corp.. MLS PIN
