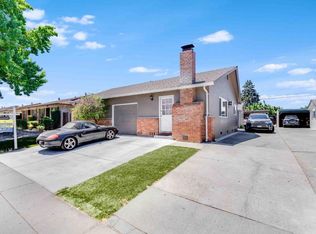
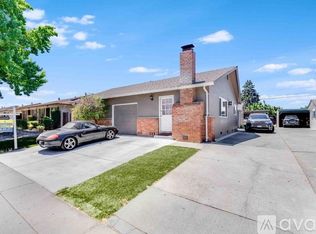
Welcome to 771 Nevin Way, a well-kept income property in San Jose's highly sought-after 95128 neighborhood. Fully leased with dependable tenants and a good cap rate, this property delivers steady cash flow from day one, along with strong long-term upside in one of Silicon Valley's most in-demand rental markets. Pride of ownership shows throughout. The buildings and grounds reflect years of consistent upkeep and attention to detail, so buyers can expect fewer surprises and lower near-term capital expenses. With area rents continuing to climb, there is room to grow income over time, and investors may explore value-add opportunities such as interior updates or a potential ADU, subject to City of San Jose approval. The location is truly hard to beat. Set on a quiet residential street, the property is minutes from Santana Row and Westfield Valley Fair, two of the Bay Area's premier destinations for shopping, dining and entertainment. Commuters enjoy quick access to Highways 280, 880 and 17, with easy connections to major tech campuses across the Valley. Diridon Station, with Caltrain, VTA, ACE and Amtrak service, and San Jose Mineta International Airport are close by, as are Downtown San Jose, Santa Clara Valley Medical Center and Santa Clara University. Local gems include Willow Glen's charming Lincoln Avenue, the historic Rose Garden neighborhood, neighborhood parks and favorite local cafs. This prime location keeps rental demand high and vacancies low, making 771 Nevin Way an outstanding addition to any portfolio, whether you are a seasoned investor or acquiring your first income property. Fully rented, well maintained and ideally located, this is an opportunity not to be missed.
For sale
$1,599,000
771 Nevin Way, San Jose, CA 95128
4beds
2,062sqft
Triplex
Built in 1961
-- sqft lot
$1,634,300 Zestimate®
$775/sqft
$-- HOA
What's special
Quiet residential street
- 9 days
- 361
- 17
Zillow last checked:
Listing updated:
Listed by:
Jason S. Tam DRE #01992165 415-730-3775,
eXp Realty of California, Inc 888-584-9427,
Reina Irias DRE #01446622 415-350-5830,
eXp Realty of California, Inc
Source: SFAR,MLS#: 426172162 Originating MLS: San Francisco Association of REALTORS
Facts & features
Interior
Bedrooms & bathrooms
- Bedrooms: 4
- Bathrooms: 4
- Full bathrooms: 4
Interior area
- Total structure area: 2,062
- Total interior livable area: 2,062 sqft
Property
Parking
- Total spaces: 2
- Parking features: Garage, Carport
- Garage spaces: 1
- Carport spaces: 1
- Covered spaces: 2
Features
- Stories: 1
Lot
- Size: 6,050 Square Feet
- Features: Other
Details
- Parcel number: 28237021
- Special conditions: Offer As Is
Construction
Type & style
- Home type: MultiFamily
- Property subtype: Triplex
Condition
- Year built: 1961
Utilities & green energy
- Sewer: Public Sewer
- Water: Public
Community & HOA
HOA
- Has HOA: No
Location
- Region: San Jose
- Elevation: 0
Financial & listing details
- Price per square foot: $775/sqft
- Tax assessed value: $1,538,750
- Price range: $1.6M - $1.6M
- Date on market: 10/29/2026
- Cumulative days on market: 8 days
- Total actual rent: 9195
Estimated market value
$1,634,300
$1.55M - $1.73M
$4,055/mo
Price history
| Date | Event | Price |
|---|---|---|
| 10/29/2026 | Listed for sale | $1,599,000+10.3%$775/sqft |
Source:  SFAR #426172162 Report a problem | ||
| 9/13/2025 | Listing removed | $3,145$2/sqft |
Source: Zillow Rentals Report a problem | ||
| 9/5/2025 | Price change | $3,145-1.6%$2/sqft |
Source: Zillow Rentals Report a problem | ||
| 7/24/2025 | Listed for rent | $3,195+52.1%$2/sqft |
Source: Zillow Rentals Report a problem | ||
| 3/27/2025 | Listing removed | $2,100$1/sqft |
Source: Zillow Rentals Report a problem | ||
| 3/18/2025 | Price change | $2,100-4.5%$1/sqft |
Source: Zillow Rentals Report a problem | ||
| 2/25/2025 | Price change | $2,200-3.3%$1/sqft |
Source: Zillow Rentals Report a problem | ||
| 2/15/2025 | Listed for rent | $2,275+8.6%$1/sqft |
Source: Zillow Rentals Report a problem | ||
| 2/14/2023 | Listing removed | -- |
Source: Zillow Rentals Report a problem | ||
| 2/5/2023 | Price change | $2,095-2.6%$1/sqft |
Source: Zillow Rentals Report a problem | ||
| 1/6/2023 | Listed for rent | $2,150-8.5%$1/sqft |
Source: Zillow Rentals Report a problem | ||
| 1/6/2023 | Listing removed | -- |
Source: Zillow Rentals Report a problem | ||
| 12/12/2022 | Price change | $2,350-1.7%$1/sqft |
Source: Zillow Rentals Report a problem | ||
| 12/3/2022 | Price change | $2,390-0.2%$1/sqft |
Source: Zillow Rental Manager Report a problem | ||
| 11/26/2022 | Listed for rent | $2,395+22.8%$1/sqft |
Source: Zillow Rental Manager Report a problem | ||
| 9/23/2022 | Sold | $1,450,000+3.6%$703/sqft |
Source: Public Record Report a problem | ||
| 8/8/2022 | Price change | $1,399,000-12.5%$678/sqft |
Source:  MLSListings Inc #ML81895798 Report a problem | ||
| 7/6/2022 | Price change | $1,599,000+14.3%$775/sqft |
Source: MLSListings Inc #ML81895798 Report a problem | ||
| 6/30/2022 | Price change | $1,399,000-12.5%$678/sqft |
Source: MLSListings Inc #ML81895798 Report a problem | ||
| 6/10/2022 | Listed for sale | $1,599,000+9.9%$775/sqft |
Source: MLSListings Inc #ML81895798 Report a problem | ||
| 3/21/2022 | Listing removed | -- |
Source: Zillow Rental Manager Report a problem | ||
| 3/15/2022 | Listed for rent | $1,950$1/sqft |
Source: Zillow Rental Manager Report a problem | ||
| 7/7/2021 | Sold | $1,455,000-2.9%$706/sqft |
Source: MLSListings Inc #ML81836310 Report a problem | ||
| 4/27/2021 | Contingent | $1,499,000$727/sqft |
Source: MLSListings Inc #ML81836310 Report a problem | ||
| 3/28/2021 | Listed for sale | $1,499,000+57.8%$727/sqft |
Source: MLSListings Inc #ML81836310 Report a problem | ||
| 12/12/2016 | Sold | $950,000+175.4%$461/sqft |
Source: Public Record Report a problem | ||
| 11/30/1998 | Sold | $345,000$167/sqft |
Source: Public Record Report a problem | ||
Public tax history
| Year | Property taxes | Tax assessment |
|---|---|---|
| 2026 | -- | $1,538,750 +2% |
| 2025 | $22,036 +3.3% | $1,508,580 +2% |
| 2024 | $21,325 +2.1% | $1,479,000 +2% |
| 2023 | $20,896 -1% | $1,450,000 -0.3% |
| 2022 | $21,102 +34.8% | $1,455,000 +42.8% |
| 2021 | $15,652 +3.4% | $1,018,589 +1% |
| 2020 | $15,139 | $1,008,146 +2% |
| 2019 | $15,139 +4.7% | $988,380 +2% |
| 2018 | $14,462 | $969,000 +2% |
| 2017 | $14,462 +1.4% | $950,000 +107.9% |
| 2016 | $14,263 +83.1% | $456,875 +1.5% |
| 2015 | $7,789 +23.2% | $450,014 +2% |
| 2014 | $6,320 | $441,200 +0.5% |
| 2013 | -- | $439,207 +2% |
| 2012 | -- | $430,596 +2% |
| 2011 | -- | $422,154 +0.8% |
| 2010 | -- | $419,000 -0.2% |
| 2009 | -- | $419,996 +2% |
| 2008 | -- | $411,762 +2% |
| 2007 | -- | $403,689 +2% |
| 2006 | -- | $395,775 +2% |
| 2005 | -- | $388,015 +2% |
| 2004 | -- | $380,408 +1.9% |
| 2003 | -- | $373,437 +2% |
| 2002 | -- | $366,116 +2% |
| 2001 | -- | $358,938 |
Find assessor info on the county website
Monthly payment
Est. payment
Payment breakdown
Explore the cost of this home by adjusting the details. Changes won't be saved.Climate risks
Neighborhood: Willow Glen


Similar homes
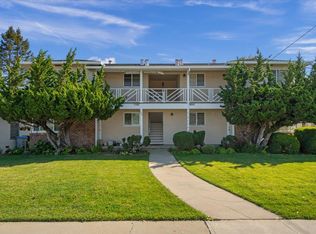
- $1,825,0004 bd4 ba2.8k sqft590 Macarthur Ave, San Jose, CA 95128For Sale
 MLS ID #ML82039567, Gaylene Wyatt. MLSListings Inc
- $1,749,0004 bd2 ba1.7k sqft1006 Westwood Dr, San Jose, CA 95125For Sale
 MLS ID #ML82060418, Zaid Hanna. MLSListings Inc
- $1,499,0004 bd2 ba2.2k sqft1119-1121 Topaz Ave, San Jose, CA 95117For Sale
 MLS ID #ML82052494, Stanley Chen. MLSListings Inc
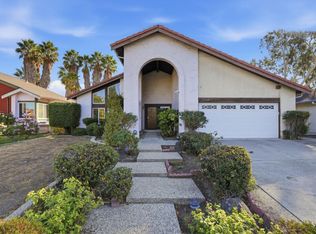
- $1,550,0004 bd2 ba1.8k sqft(Undisclosed Address), San Jose, CA 95148For Sale
 MLS ID #ML82066590, May Cheung. MLSListings Inc
