This 2741 square foot single family home has 5 bedrooms and 3.5 bathrooms. This home is located at 771 Rise Canyon Dr, Henderson, NV 89052.
Pre-foreclosure
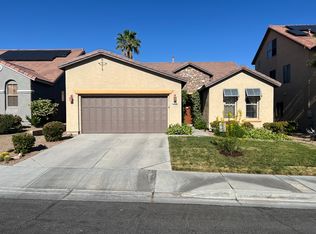
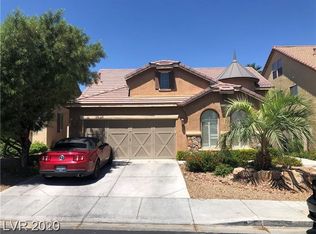
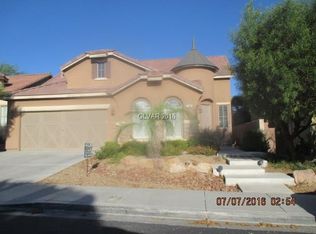
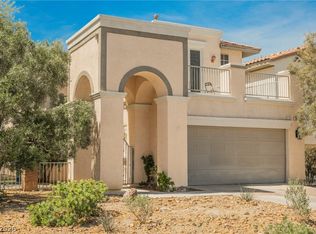
Street View
Est. $598,400
771 Rise Canyon Dr, Henderson, NV 89052
5beds
3baths
2,741sqft
SingleFamily
Built in 2003
4,791 Square Feet Lot
$598,400 Zestimate®
$218/sqft
$48/mo HOA
Overview
- 94 days |
- 12 |
- 1 |
Facts & features
Interior
Bedrooms & bathrooms
- Bedrooms: 5
- Bathrooms: 3.5
Heating
- Forced air
Cooling
- Central
Features
- Flooring: Other, Carpet, Concrete, Linoleum / Vinyl
- Has fireplace: Yes
Interior area
- Total interior livable area: 2,741 sqft
Property
Parking
- Parking features: Garage - Attached
Features
- Exterior features: Stucco
Lot
- Size: 4,791 Square Feet
Details
- Parcel number: 17830811006
Construction
Type & style
- Home type: SingleFamily
Materials
- Frame
- Roof: Other
Condition
- Year built: 2003
Community & HOA
HOA
- Has HOA: Yes
- HOA fee: $48 monthly
Location
- Region: Henderson
Financial & listing details
- Price per square foot: $218/sqft
- Tax assessed value: $478,574
- Annual tax amount: $2,694
Visit our professional directory to find a foreclosure specialist in your area that can help with your home search.
Find a foreclosure agentForeclosure details
Estimated market value
$598,400
$562,000 - $634,000
$2,730/mo
Price history
| Date | Event | Price |
|---|---|---|
| 8/26/2003 | Sold | $289,208$106/sqft |
Source: Public Record Report a problem | ||
Public tax history
| Year | Property taxes | Tax assessment |
|---|---|---|
| 2026 | $2,694 +3% | $167,501 +0% |
| 2025 | $2,615 +3% | $167,491 +11.9% |
| 2024 | $2,540 +3% | $149,625 +9.5% |
| 2023 | $2,466 +3% | $136,652 +4% |
| 2022 | $2,394 +3% | $131,431 +0.7% |
| 2021 | $2,324 +3% | $130,541 +7.8% |
| 2020 | $2,256 +3% | $121,085 -2.9% |
| 2019 | $2,190 +5.7% | $124,739 |
| 2018 | $2,072 | $124,739 +0% |
| 2017 | $2,072 | $124,684 +15.9% |
| 2016 | $2,072 +0.2% | $107,562 +13.3% |
| 2015 | $2,068 +3% | $94,950 +22.9% |
| 2014 | $2,008 | $77,254 |
| 2013 | -- | $77,254 +18.3% |
| 2012 | -- | $65,281 -14.1% |
| 2011 | -- | $75,956 -14.9% |
| 2010 | -- | $89,283 -1.2% |
| 2009 | -- | $90,385 |
| 2008 | -- | $90,385 -41.8% |
| 2007 | -- | $155,221 +4% |
| 2006 | -- | $149,275 +35.7% |
| 2005 | -- | $109,995 +13.7% |
| 2004 | -- | $96,705 |
Find assessor info on the county website
Monthly payment
Estimated monthly payment$1,822
All calculations are estimates and provided by Zillow, Inc. for informational purposes only. Actual amounts may vary.
HOA fees may include property taxes on listings classified as Co-Ops. Contact the listing agent and/or owner for fee details.
Mortgage interest rates are dependent on a number of factors, including credit score, down payment, and repayment length. Interest rate data provided by Zillow Group Marketplace, Inc. as of 1/1/1970 from various mortgage lenders with which we have lead or other similar arrangements; the Estimated Payment is an average of those rates.
See how much you could borrow to make a competitive offer.
Climate risks
Neighborhood: MacDonald Ranch
Nearby schools
GreatSchools rating
- 7/10Glen C. Taylor Elementary SchoolGrades: PK-5Distance: 1 mi
- 7/10Bob Miller Middle SchoolGrades: 6-8Distance: 1 mi
- 7/10Coronado High SchoolGrades: 9-12Distance: 1.2 mi


- Nevada
- Clark County
- Henderson
- 89052
- MacDonald Ranch
- 771 Rise Canyon Dr
Nearby cities
Nearby neighborhoods
Nearby zip codes
Other Henderson Topics
