Home is sold As-Is, great opportunity for some sweat equity. Great Waldo location.
Active
Price cut: $1K (10/21)
$169,000
7811 Summit St, Kansas City, MO 64114
2beds
1,001sqft
Single Family Residence
Built in 1940
6,391 Square Feet Lot
$-- Zestimate®
$169/sqft
$-- HOA
What's special
- 20 days
- 973
- 55
Zillow last checked:
Listing updated:
Listed by:
Jake Zillner 913-963-7355,
Modern Realty Advisors
Source: Heartland MLS as distributed by MLS GRID,MLS#: 2645226
Facts & features
Interior
Bedrooms & bathrooms
- Bedrooms: 2
- Bathrooms: 2
- Full bathrooms: 2
Heating
- Forced Air
Cooling
- Electric
Features
- Basement: Crawl Space
- Number of fireplaces: 1
Interior area
- Total structure area: 1,001
- Total interior livable area: 1,001 sqft
- Finished area above ground: 1,001
- Finished area below ground: 0
Property
Parking
- Total spaces: 1
- Parking features: Detached
- Garage spaces: 1
Lot
- Size: 6,391 Square Feet
Details
- Parcel number: 47910290500000000
Construction
Type & style
- Home type: SingleFamily
- Property subtype: Single Family Residence
Materials
- Frame, Vinyl Siding
- Roof: Composition
Condition
- Year built: 1940
Utilities & green energy
- Sewer: Public Sewer
- Water: Public
Community & HOA
Community
- Subdivision: Moreland Place
HOA
- Has HOA: No
Location
- Region: Kansas City
Financial & listing details
- Price per square foot: $169/sqft
- Tax assessed value: $195,730
- Annual tax amount: $3,119
- Date on market: 10/2/2026
- Listing terms: Cash,Conventional
- Exclusions: Entire Home
- Ownership: Investor
Estimated market value
Not available
Estimated sales range
Not available
Not available
Price history
| Date | Event | Price |
|---|---|---|
| 10/21/2026 | Price change | $169,000-0.6%$169/sqft |
Source:  Heartland MLS as distributed by MLS GRID #2645226 Report a problem | ||
| 10/15/2026 | Pending sale | $170,000$170/sqft |
Source: Heartland MLS as distributed by MLS GRID #2645226 Report a problem | ||
| 10/2/2026 | Listed for sale | $170,000+13.3%$170/sqft |
Source: Heartland MLS as distributed by MLS GRID #2645226 Report a problem | ||
| 9/22/2026 | Sold | -- |
Source: Heartland MLS as distributed by MLS GRID #2641273 Report a problem | ||
| 9/13/2026 | Pending sale | $150,000$150/sqft |
Source: Heartland MLS as distributed by MLS GRID #2641273 Report a problem | ||
| 9/10/2026 | Listed for sale | $150,000+32.9%$150/sqft |
Source: Heartland MLS as distributed by MLS GRID #2641273 Report a problem | ||
| 5/11/2023 | Listing removed | -- |
Source: Zillow Rentals Report a problem | ||
| 5/1/2023 | Listed for rent | $1,500+15.5%$1/sqft |
Source: Zillow Rentals Report a problem | ||
| 9/28/2021 | Listing removed | -- |
Source: Zillow Rental Manager Report a problem | ||
| 9/15/2021 | Listed for rent | $1,299$1/sqft |
Source: Zillow Rental Manager Report a problem | ||
| 3/24/2021 | Listing removed | -- |
Source: Owner Report a problem | ||
| 6/19/2019 | Listing removed | $1,299$1/sqft |
Source: Owner Report a problem | ||
| 6/18/2019 | Price change | $1,299+8.3%$1/sqft |
Source: Owner Report a problem | ||
| 6/5/2019 | Price change | $1,199-4.1%$1/sqft |
Source: Owner Report a problem | ||
| 5/1/2019 | Listed for rent | $1,250+4.2%$1/sqft |
Source: Owner Report a problem | ||
| 2/24/2018 | Listing removed | $1,200$1/sqft |
Source: Owner Report a problem | ||
| 2/21/2018 | Listed for rent | $1,200+4.3%$1/sqft |
Source: Owner Report a problem | ||
| 1/10/2017 | Listing removed | $1,150+4.5%$1/sqft |
Source: Owner Report a problem | ||
| 9/7/2014 | Listing removed | $1,100$1/sqft |
Source: Owner Report a problem | ||
| 9/2/2014 | Listed for rent | $1,100$1/sqft |
Source: Owner Report a problem | ||
| 7/10/2014 | Sold | -- |
Source: Heartland MLS as distributed by MLS GRID #45001_1883747 Report a problem | ||
| 5/18/2014 | Listed for sale | $112,900+7.5%$113/sqft |
Source: Brookside Real Estate Co. #1883747 Report a problem | ||
| 6/9/2009 | Listing removed | $105,000$105/sqft |
Source: Realty Executives Mid-America Region #1607663 Report a problem | ||
| 5/15/2009 | Price change | $105,000-2.7%$105/sqft |
Source: Realty Executives Mid-America Region #1607663 Report a problem | ||
| 4/23/2009 | Listed for sale | $107,900$108/sqft |
Source: Realty Executives Mid-America Region #1607663 Report a problem | ||
Public tax history
| Year | Property taxes | Tax assessment |
|---|---|---|
| 2025 | $3,119 +2% | $37,189 -4.1% |
| 2024 | $3,059 +1% | $38,762 |
| 2023 | $3,030 +31% | $38,762 +37.8% |
| 2022 | $2,313 +0.3% | $28,120 |
| 2021 | $2,305 +12.4% | $28,120 +13.9% |
| 2020 | $2,050 +2.1% | $24,696 |
| 2019 | $2,007 | $24,696 +14.9% |
| 2018 | $2,007 +12.6% | $21,493 |
| 2017 | $1,783 +6.5% | $21,493 +2.6% |
| 2016 | $1,674 +1.4% | $20,955 +2% |
| 2014 | $1,651 +7% | $20,544 |
| 2013 | $1,542 +0.5% | $20,544 +8.2% |
| 2012 | $1,535 +0.1% | $18,988 |
| 2011 | $1,533 +0.9% | $18,988 |
| 2010 | $1,520 -3.5% | $18,988 |
| 2009 | $1,576 +0.5% | $18,988 -4% |
| 2008 | $1,569 -0.9% | $19,779 |
| 2007 | $1,583 +0% | $19,779 |
| 2006 | $1,583 +88% | $19,779 |
| 2005 | $842 +0.1% | $19,779 +87.2% |
| 2004 | $841 +14.3% | $10,565 |
| 2003 | $736 +0.3% | $10,565 +15% |
| 2002 | $734 +11.7% | $9,186 |
| 2001 | $657 | $9,186 |
Find assessor info on the county website
Monthly payment
Est. payment
Payment breakdown
Explore the cost of this home by adjusting the details. Changes won't be saved.Climate risks
Neighborhood: Ward Parkway


Similar homes
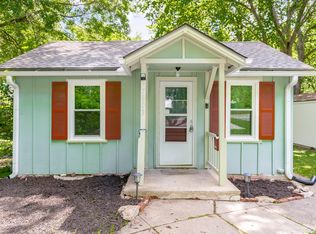
- $189,9992 bd2 ba1.1k sqft7740 Madison Ave, Kansas City, MO 64114For Sale
 MLS ID #2631993, Michelle Saporito, Keller Williams Realty Partners Inc.. Heartland MLS as distributed by MLS GRID
- $159,0004 bd2 ba1.2k sqft3812 E 93rd St, Kansas City, MO 64132For Sale
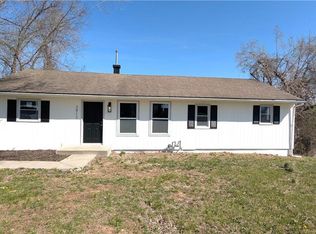 MLS ID #2647661, Riyad Naser, Keller Williams Platinum Prtnr. Heartland MLS as distributed by MLS GRID
- $200,0003 bd1 ba910 sqft214 E 79th Ter, Kansas City, MO 64114For Sale
 MLS ID #2645029, Kelli Becks, Keller Williams Realty Partners Inc.. Heartland MLS as distributed by MLS GRID
- $192,0002 bd1 ba756 sqft9248 McGee St, Kansas City, MO 64114For Sale
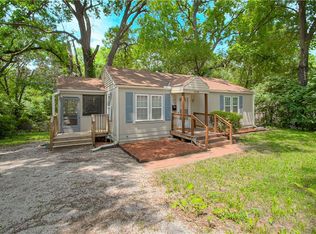 MLS ID #2633264, Bruce Kay, RE/MAX Premier Realty. Heartland MLS as distributed by MLS GRID
