Great investment opportunity in Chicago! This property is ideal for investors looking to add to their portfolio or buyers interested in house hacking. Whether you're looking to generate rental income or live in the property while renting out additional space, this is an opportunity worth exploring. Conveniently located near shopping, dining, public transportation, and neighborhood amenities. Don't miss out!
New
$505,000
7845 S Peoria St, Chicago, IL 60620
8beds
--sqft
Multi Family
Built in 1920
-- sqft lot
$500,800 Zestimate®
$--/sqft
$-- HOA
What's special
- 2 days
- 62
- 7
Zillow last checked:
Listing updated:
Listed by:
JC Gonzalez (773)791-9219,
eXp Realty
Source: MRED as distributed by MLS GRID,MLS#: 12799807
Facts & features
Interior
Bedrooms & bathrooms
- Bedrooms: 8
- Bathrooms: 3
- Full bathrooms: 4
Heating
- Radiator(s)
Features
- Basement: Finished,Full
Video & virtual tour
Property
Parking
- Total spaces: 3
- Parking features: Yes, Garage Owned, Detached, Garage
- Garage spaces: 3
Lot
- Size: 4,373 Square Feet
Details
- Parcel number: 20294300130000
- Special conditions: None
Construction
Type & style
- Home type: MultiFamily
- Property subtype: Multi Family
Materials
- Brick
Condition
- New construction: No
- Year built: 1920
Utilities & green energy
- Sewer: Public Sewer
- Water: Lake Michigan
Community & HOA
Location
- Region: Chicago
Financial & listing details
- Tax assessed value: $180,010
- Annual tax amount: $3,751
- Date on market: 11/3/2026
- Ownership: Fee Simple
Estimated market value
$500,800
$476,000 - $526,000
$1,821/mo
Price history
| Date | Event | Price |
|---|---|---|
| 11/3/2026 | Listed for sale | $505,000+5.4% |
Source:  MRED as distributed by MLS GRID #12799807 Report a problem | ||
| 12/8/2025 | Sold | $479,000 |
Source: MRED as distributed by MLS GRID #12528776 Report a problem | ||
| 12/6/2025 | Listed for sale | $479,000+166.1% |
Source: MRED as distributed by MLS GRID #12528776 Report a problem | ||
| 11/19/2025 | Listing removed | $2,300 |
Source: Zillow Rentals Report a problem | ||
| 7/17/2025 | Listed for rent | $2,300+53.3% |
Source: Zillow Rentals Report a problem | ||
| 9/13/2024 | Listing removed | $1,500 |
Source: Zillow Rentals Report a problem | ||
| 6/23/2024 | Listed for rent | $1,500 |
Source: Zillow Rentals Report a problem | ||
| 4/29/2024 | Listing removed | -- |
Source: Zillow Rentals Report a problem | ||
| 3/29/2024 | Listed for rent | $1,500 |
Source: Zillow Rentals Report a problem | ||
| 11/22/2023 | Listing removed | -- |
Source: Zillow Rentals Report a problem | ||
| 6/22/2023 | Listed for rent | $1,500 |
Source: Zillow Rentals Report a problem | ||
| 12/30/2022 | Sold | $180,000-10% |
Source: MRED as distributed by MLS GRID #11684608 Report a problem | ||
| 12/14/2022 | Pending sale | $200,000 |
Source: MRED as distributed by MLS GRID #11684608 Report a problem | ||
| 12/13/2022 | Listing removed | -- |
Source:  RE/MAX International Report a problem | ||
| 12/7/2022 | Listed for sale | $200,000 |
Source: MRED as distributed by MLS GRID #11684608 Report a problem | ||
Public tax history
| Year | Property taxes | Tax assessment |
|---|---|---|
| 2024 | $3,617 -14.3% | $18,001 -10% |
| 2023 | $4,220 +48.2% | $19,999 |
| 2022 | $2,847 +971.7% | $19,999 |
| 2021 | $266 -3.1% | $19,999 +42.1% |
| 2020 | $274 +0.3% | $14,071 -12% |
| 2019 | $273 +1.5% | $15,990 |
| 2018 | $269 -6.6% | $15,990 -19.1% |
| 2017 | $288 -59.5% | $19,777 |
| 2016 | $712 +4% | $19,777 |
| 2015 | $684 +0.9% | $19,777 +9% |
| 2014 | $679 -0.4% | $18,152 |
| 2013 | $681 +6.8% | $18,152 |
| 2012 | $637 -2.3% | $18,152 -18.1% |
| 2011 | $653 +10.6% | $22,156 |
| 2010 | $590 +6.6% | $22,156 |
| 2009 | $554 -7.8% | $22,156 -11.3% |
| 2008 | $600 -10.7% | $24,974 |
| 2007 | $673 -5.8% | $24,974 |
| 2006 | $714 -14.5% | $24,974 +37% |
| 2005 | $835 -4.8% | $18,224 |
| 2004 | $877 -8.9% | $18,224 |
| 2003 | $963 -11.6% | $18,224 +13.8% |
| 2002 | $1,089 -6.6% | $16,021 |
| 2001 | $1,166 -8.8% | $16,021 |
| 2000 | $1,278 -48.4% | $16,021 +64.1% |
| 1999 | $2,478 | $9,761 |
Find assessor info on the county website
Monthly payment
Est. payment
Payment breakdown
Explore the cost of this home by adjusting the details. Changes won't be saved.Climate risks
Neighborhood: Gresham
Nearby schools


Similar homes
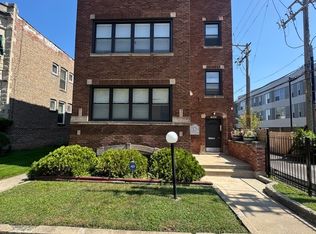
- $429,9998 bd3 ba-- sqft8755 S Cottage Grove Ave, Chicago, IL 60619New
 MLS ID #12801434, Ja'Mal Green, EXIT Strategy Realty. MRED as distributed by MLS GRID
- $399,9005 bd2 ba-- sqft6961 S Eberhart Ave, Chicago, IL 60637New
 MLS ID #12802527, Konstantin Shelegeda, Inter Properties Inc. MRED as distributed by MLS GRID
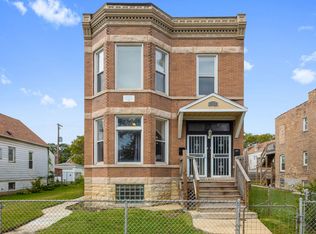
- $429,9996 bd2 ba-- sqft7322 S Langley Ave, Chicago, IL 60619Re-activated
 MLS ID #12747469, LeRoi Catlin, Kale Realty. MRED as distributed by MLS GRID
- $399,9008 bd5 ba-- sqft8952 S Aberdeen St, Chicago, IL 60620Active
 MLS ID #12689072, Joseph Konney, Top Care Realty LLC. MRED as distributed by MLS GRID
