$--
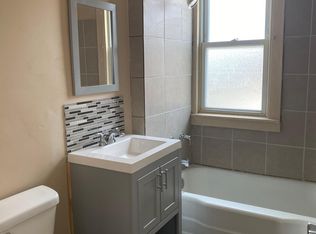
2 bd|1 ba|-- sqft
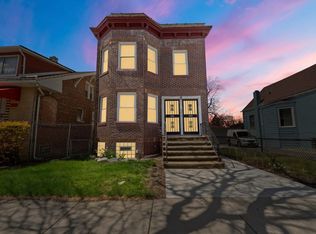
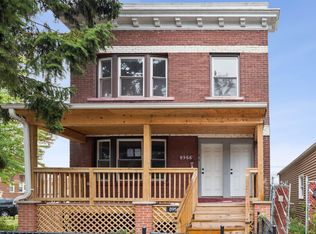
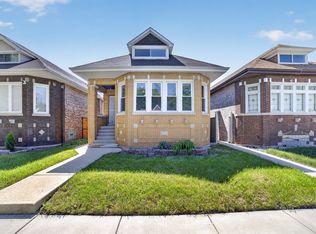
8950 S Aberdeen St #2, Chicago, IL 60620
Off Market
Zillow last checked:
Listing updated:
Joseph Konney (630)350-0363,
Top Care Realty LLC
Not available
Estimated sales range
Not available
Not available
| Date | Event | Price |
|---|---|---|
| 6/26/2026 | Listed for sale | $450,000+8.4% |
Source: | ||
| 6/26/2026 | Listing removed | $415,000 |
Source: | ||
| 3/20/2026 | Price change | $415,000-2.4% |
Source: | ||
| 11/12/2025 | Price change | $425,000-5.6% |
Source: | ||
| 11/3/2025 | Listed for sale | $450,000+210.3% |
Source: | ||
| 1/18/2022 | Sold | $145,000 |
Source: Public Record Report a problem | ||
| 11/3/2021 | Sold | $145,000-12.1% |
Source: | ||
| 10/12/2021 | Pending sale | $165,000 |
Source: | ||
| 10/5/2021 | Price change | $165,000-5.7% |
Source: | ||
| 9/22/2021 | Listed for sale | $175,000+75.2% |
Source: | ||
| 9/10/2019 | Listing removed | $99,900 |
Source: Keller Williams Elite #10424777 Report a problem | ||
| 8/16/2019 | Price change | $99,900-13.1% |
Source: Keller Williams Elite #10424777 Report a problem | ||
| 6/21/2019 | Price change | $115,000-14.8% |
Source: Keller Williams Elite #10424777 Report a problem | ||
| 5/2/2019 | Price change | $135,000-15.1% |
Source: Keller Williams Elite #10314471 Report a problem | ||
| 4/15/2019 | Price change | $159,000-6.4% |
Source: Keller Williams Elite #10314471 Report a problem | ||
| 3/14/2019 | Listed for sale | $169,900-8.2% |
Source: Premier Midwest Realty INC #10307418 Report a problem | ||
| 1/23/2019 | Listing removed | $185,000 |
Source: Royal Crest Realty Inc. #10118780 Report a problem | ||
| 10/22/2018 | Listed for sale | $185,000 |
Source: Royal Crest Realty Inc. #10118780 Report a problem | ||
| Year | Property taxes | Tax assessment |
|---|---|---|
| 2024 | -- | $18,699 +70% |
| 2023 | $2,326 +2.5% | $10,999 |
| 2022 | $2,269 +391.4% | $10,999 |
| 2021 | $462 -45.3% | $10,999 -18.8% |
| 2020 | $845 +1.4% | $13,546 -9% |
| 2019 | $833 +1.9% | $14,885 |
| 2018 | $818 -34.5% | $14,885 -17.7% |
| 2017 | $1,249 -19.7% | $18,084 |
| 2016 | $1,555 +10.2% | $18,084 |
| 2015 | $1,411 +16.6% | $18,084 +15.3% |
| 2014 | $1,210 +2.5% | $15,680 |
| 2013 | $1,180 +0.3% | $15,680 |
| 2012 | $1,177 +6.5% | $15,680 -18.9% |
| 2009 | $1,105 +4% | $19,338 -19.1% |
| 2008 | $1,062 -38% | $23,917 |
| 2006 | $1,712 +84.8% | $23,917 +116.4% |
| 2005 | $926 -12.6% | $11,052 |
| 2004 | $1,060 +9.9% | $11,052 |
| 2003 | $964 +7.7% | $11,052 +25% |
| 2002 | $895 +2.5% | $8,843 |
| 2001 | $873 +5.1% | $8,843 |
| 2000 | $831 | $8,843 +19% |
| 1999 | $831 | $7,431 |
Find assessor info on the county website
Source: MRED as distributed by MLS GRID. This data may not be complete. We recommend contacting the local school district to confirm school assignments for this home.
A local agent can set up tours, give advice and negotiate with sellers.
A local lender can help you make sure your offer is ready when you are.