$--
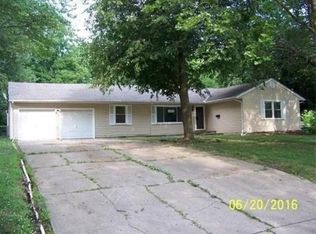
4 bd|3 ba|1.9k sqft
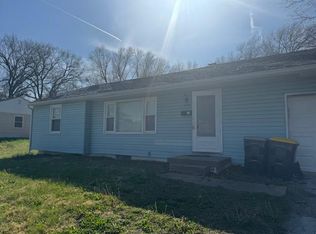
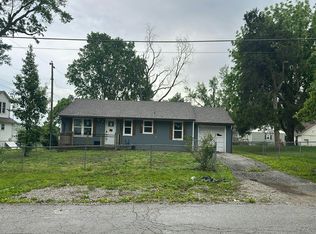
8023 Tennessee Ave, Raytown, MO 64138
Sold
Zillow last checked:
Listing updated:
Natosha Elliott 816-695-8338,
Weichert Realtors - Generations,
Gary Ashley Sr. 816-787-8218,
Weichert Realtors - Generations
Not available
Estimated sales range
Not available
Not available
| Date | Event | Price |
|---|---|---|
| 6/25/2026 | Pending sale | $130,000$113/sqft |
Source: | ||
| 6/25/2026 | Listed for sale | $130,000+160%$113/sqft |
Source: | ||
| 4/28/2020 | Listing removed | $1,200$1/sqft |
Source: Zillow Rental Network Premium Report a problem | ||
| 4/22/2020 | Listed for rent | $1,200$1/sqft |
Source: Zillow Rental Network Premium Report a problem | ||
| 3/7/2018 | Listing removed | $1,200$1/sqft |
Source: MRE Property Management LLC Report a problem | ||
| 1/17/2018 | Listed for rent | $1,200$1/sqft |
Source: MRE Property Management LLC Report a problem | ||
| 7/20/2017 | Sold | -- |
Source: | ||
| 4/5/2017 | Listed for sale | $50,000$43/sqft |
Source: RE/MAX Heritage #2015178 Report a problem | ||
| 1/7/2017 | Pending sale | $50,000$43/sqft |
Source: RE/MAX Heritage #2015178 Report a problem | ||
| 1/7/2017 | Price change | $50,000-13.8%$43/sqft |
Source: RE/MAX Heritage #2015178 Report a problem | ||
| 10/4/2016 | Listed for sale | $58,000$50/sqft |
Source: RE/MAX Heritage #2015178 Report a problem | ||
| Year | Property taxes | Tax assessment |
|---|---|---|
| 2025 | $2,350 -31.2% | $25,880 -31.7% |
| 2024 | $3,418 +0.7% | $37,890 |
| 2023 | $3,395 +84.4% | $37,890 +93.6% |
| 2022 | $1,841 -0.3% | $19,571 |
| 2021 | $1,847 -1.2% | $19,571 -0.3% |
| 2020 | $1,871 +0.5% | $19,628 |
| 2019 | $1,860 | $19,628 +14.9% |
| 2018 | $1,860 +15.6% | $17,082 |
| 2017 | $1,609 +5.9% | $17,082 +2.6% |
| 2016 | $1,520 +2.1% | $16,654 +3% |
| 2014 | $1,489 +0.1% | $16,169 |
| 2013 | $1,487 +0.1% | $16,169 |
| 2012 | $1,486 +9.3% | $16,169 |
| 2011 | $1,359 +1.5% | $16,169 +9.6% |
| 2010 | $1,339 -8.2% | $14,755 |
| 2009 | $1,458 +12.3% | $14,755 -16% |
| 2008 | $1,299 -0.3% | $17,565 |
| 2007 | $1,302 +6.8% | $17,565 |
| 2006 | $1,220 +10.3% | $17,565 |
| 2005 | $1,106 +0% | $17,565 +15% |
| 2004 | $1,106 +11.6% | $15,274 |
| 2003 | $991 +0.1% | $15,274 +15% |
| 2002 | $990 +12.5% | $13,282 |
| 2001 | $880 | $13,282 |
Find assessor info on the county website
Source: Heartland MLS as distributed by MLS GRID. This data may not be complete. We recommend contacting the local school district to confirm school assignments for this home.
A local agent can set up tours, give advice and negotiate with sellers.
A local lender can help you make sure your offer is ready when you are.