This 840 square foot single family home has 2 bedrooms and 1.0 bathrooms. This home is located at 820 Allen St, Denton, TX 76205.
Foreclosed
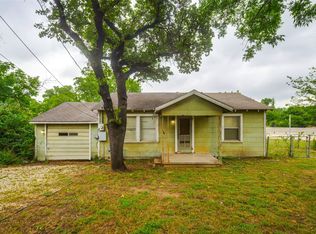
Street View
Est. $164,601
820 Allen St, Denton, TX 76205
2beds
1baths
840sqft
SingleFamily
Built in 1958
7,030 Square Feet Lot
$-- Zestimate®
$196/sqft
$-- HOA
Overview
- 288 days |
- 40 |
- 0 |
Facts & features
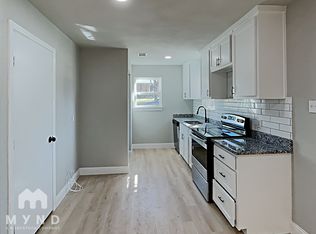
Interior
Bedrooms & bathrooms
- Bedrooms: 2
- Bathrooms: 1
Heating
- Other
Interior area
- Total interior livable area: 840 sqft
Property
Features
- Exterior features: Wood
Lot
- Size: 7,030 Square Feet
Details
- Parcel number: R27502
Construction
Type & style
- Home type: SingleFamily
Materials
- Roof: Composition
Condition
- Year built: 1958
Community & HOA
Location
- Region: Denton
Financial & listing details
- Price per square foot: $196/sqft
- Tax assessed value: $164,601
- Annual tax amount: $1,544
Visit our professional directory to find a foreclosure specialist in your area that can help with your home search.
Find a foreclosure agentForeclosure details
Estimated market value
Not available
Estimated sales range
Not available
$1,611/mo
Price history
| Date | Event | Price |
|---|---|---|
| 4/20/2026 | Listing removed | $154,600$184/sqft |
Source: NTREIS #21142994 Report a problem | ||
| 4/7/2026 | Pending sale | $154,600$184/sqft |
Source: NTREIS #21142994 Report a problem | ||
| 3/14/2026 | Contingent | $154,600$184/sqft |
Source: NTREIS #21142994 Report a problem | ||
| 3/5/2026 | Price change | $154,600-15%$184/sqft |
Source: NTREIS #21142994 Report a problem | ||
| 2/10/2026 | Price change | $181,900-15%$217/sqft |
Source: NTREIS #21142994 Report a problem | ||
| 1/5/2026 | Listed for sale | $214,000+4.4%$255/sqft |
Source: NTREIS #21142994 Report a problem | ||
| 9/16/2025 | Sold | -- |
Source: Public Record Report a problem | ||
| 8/11/2025 | Contingent | $205,000$244/sqft |
Source: NTREIS #20759636 Report a problem | ||
| 5/20/2025 | Listed for sale | $205,000$244/sqft |
Source: NTREIS #20759636 Report a problem | ||
| 5/1/2025 | Pending sale | $205,000$244/sqft |
Source: NTREIS #20759636 Report a problem | ||
| 5/1/2025 | Listed for sale | $205,000$244/sqft |
Source: NTREIS #20759636 Report a problem | ||
| 4/3/2025 | Contingent | $205,000$244/sqft |
Source: NTREIS #20759636 Report a problem | ||
| 10/25/2024 | Listed for sale | $205,000+3%$244/sqft |
Source: NTREIS #20759636 Report a problem | ||
| 12/14/2021 | Sold | -- |
Source: NTREIS #14700771 Report a problem | ||
| 12/4/2021 | Pending sale | $199,000$237/sqft |
Source: NTREIS #14700771 Report a problem | ||
| 11/30/2021 | Contingent | $199,000$237/sqft |
Source: NTREIS #14700771 Report a problem | ||
| 11/23/2021 | Listed for sale | $199,000$237/sqft |
Source: NTREIS #14700771 Report a problem | ||
| 11/19/2021 | Contingent | $199,000$237/sqft |
Source: NTREIS #14700771 Report a problem | ||
| 10/29/2021 | Listed for sale | $199,000+123.6%$237/sqft |
Source: NTREIS #14700771 Report a problem | ||
| 9/1/2021 | Sold | -- |
Source: NTREIS #14635139 Report a problem | ||
| 8/21/2021 | Pending sale | $89,000$106/sqft |
Source: NTREIS #14635139 Report a problem | ||
| 8/14/2021 | Listed for sale | $89,000$106/sqft |
Source: NTREIS #14635139 Report a problem | ||
| 8/6/2021 | Pending sale | $89,000$106/sqft |
Source: NTREIS #14635139 Report a problem | ||
| 7/27/2021 | Listed for sale | $89,000$106/sqft |
Source: NTREIS #14635139 Report a problem | ||
Public tax history
| Year | Property taxes | Tax assessment |
|---|---|---|
| 2025 | $1,544 -37.3% | $164,601 -13.1% |
| 2024 | $2,461 -43.2% | $189,431 -16.5% |
| 2023 | $4,333 +7.7% | $226,912 +19.8% |
| 2022 | $4,022 +196.1% | $189,453 +201.5% |
| 2021 | $1,358 +11.1% | $62,846 +14.3% |
| 2020 | $1,223 -2.7% | $55,000 |
| 2019 | $1,257 +5.4% | $55,000 +10% |
| 2018 | $1,193 +27% | $50,000 +31.6% |
| 2017 | $939 | $38,000 |
| 2016 | $939 +10.4% | $38,000 +11.8% |
| 2015 | $851 | $34,000 |
| 2014 | $851 | $34,000 +6.3% |
| 2013 | $851 | $32,000 |
| 2012 | -- | $32,000 |
| 2011 | -- | $32,000 +3.2% |
| 2010 | -- | $31,000 |
| 2009 | -- | $31,000 +9.9% |
| 2007 | $740 -3.2% | $28,200 +0.4% |
| 2006 | $764 +0.4% | $28,100 +0.4% |
| 2005 | $761 | $28,000 -2.8% |
| 2004 | -- | $28,800 +2.7% |
| 2003 | -- | $28,050 +5.4% |
| 2002 | -- | $26,606 +32.2% |
| 2001 | -- | $20,119 |
Find assessor info on the county website
Monthly payment
Estimated monthly payment$1,822
All calculations are estimates and provided by Zillow, Inc. for informational purposes only. Actual amounts may vary.
HOA fees may include property taxes on listings classified as Co-Ops. Contact the listing agent and/or owner for fee details.
Mortgage interest rates are dependent on a number of factors, including credit score, down payment, and repayment length. Interest rate data provided by Zillow Group Marketplace, Inc. as of 1/1/1970 from various mortgage lenders with which we have lead or other similar arrangements; the Estimated Payment is an average of those rates.
See how much you could borrow to make a competitive offer.
Climate risks
Neighborhood: Southeast Denton
Nearby schools
GreatSchools rating
- 3/10Borman Elementary SchoolGrades: PK-5Distance: 1.5 mi
- 5/10Calhoun Middle SchoolGrades: 6-8Distance: 1.7 mi
- 5/10Denton High SchoolGrades: 9-12Distance: 3.7 mi


- Texas
- Denton County
- Denton
- 76205
- Southeast Denton
- 820 Allen St
Nearby cities
Nearby neighborhoods
Nearby zip codes
Other Denton Topics
