Fully rented 3 bedrooms, 1 bath units duplex just north of Bemidji on Irvine Ave.
Pending
$249,000
8380 Thompson Ct NW, Bemidji, MN 56601
6beds
2baths
2,016sqft
Duplex Side by Side
Built in 1950
-- sqft lot
$237,100 Zestimate®
$124/sqft
$-- HOA
What's special
- 39 days
- 271
- 8
Zillow last checked:
Listing updated:
Listed by:
Richard Phelps 218-751-1228,
Century 21 Dickinson
Source: NorthstarMLS as distributed by MLS GRID,MLS#: 7140640
Facts & features
Interior
Bedrooms & bathrooms
- Bedrooms: 6
- Bathrooms: 2
Heating
- Forced Air
Features
- Basement: None
Interior area
- Total structure area: 2,016
- Total interior livable area: 2,016 sqft
- Finished area above ground: 2,016
- Finished area below ground: 0
Property
Parking
- Parking features: Parking Lot
Accessibility
- Accessibility features: None
Features
- Levels: One
Lot
- Size: 1.31 Acres
- Dimensions: 180 x 250
- Features: Corner Lot
Details
- Foundation area: 2016
- Parcel number: 310039401
- Zoning description: Residential-Multi-Family
Construction
Type & style
- Home type: MultiFamily
- Property subtype: Duplex Side by Side
Condition
- New construction: No
- Year built: 1950
Utilities & green energy
- Electric: Power Company: Beltrami Electric Cooperative
- Gas: Natural Gas
- Sewer: Private Sewer
- Water: Private
Community & HOA
Location
- Region: Bemidji
Financial & listing details
- Price per square foot: $124/sqft
- Tax assessed value: $189,700
- Annual tax amount: $2,662
- Date on market: 9/10/2026
- Cumulative days on market: 39 days
Estimated market value
$237,100
$225,000 - $249,000
$1,290/mo
Price history
| Date | Event | Price |
|---|---|---|
| 10/16/2026 | Pending sale | $249,000$124/sqft |
Source:  NorthstarMLS as distributed by MLS GRID #7140640 Report a problem | ||
| 9/10/2026 | Listed for sale | $249,000$124/sqft |
Source: NorthstarMLS as distributed by MLS GRID #7140640 Report a problem | ||
Public tax history
| Year | Property taxes | Tax assessment |
|---|---|---|
| 2025 | $2,178 +4.6% | $189,700 -1.7% |
| 2024 | $2,082 +16.2% | $193,000 +5% |
| 2023 | $1,792 +3.8% | $183,800 |
| 2022 | $1,726 -1.1% | -- |
| 2021 | $1,746 +3.9% | -- |
| 2020 | $1,680 -10.8% | -- |
| 2018 | $1,884 +11.7% | -- |
| 2016 | $1,686 +3.1% | $98,900 +3.5% |
| 2015 | $1,636 +2% | $95,600 |
| 2014 | $1,604 -5.4% | $95,600 -7.9% |
| 2011 | $1,696 | $103,800 |
Find assessor info on the county website
Monthly payment
Est. payment
Payment breakdown
Explore the cost of this home by adjusting the details. Changes won't be saved.Climate risks
Neighborhood: 56601

Similar homes
- $259,0003 bd2 ba1.8k sqft11268 Cohen Loop NW, Bemidji, MN 56601For Sale
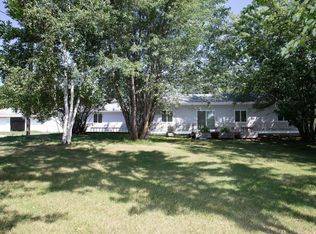
 MLS ID #7121153, Kiel Browne, Grimes Realty. NorthstarMLS as distributed by MLS GRID
- $224,9003 bd2 ba2k sqft7205 Belmont St NW, Bemidji, MN 56601For Sale
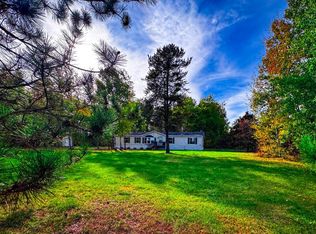 MLS ID #7159467, Jill Larson, Headwaters Realty Services LLC. NorthstarMLS as distributed by MLS GRID
- $265,0006 bd3 ba2.1k sqft215 9th St NW, Bemidji, MN 56601For Sale
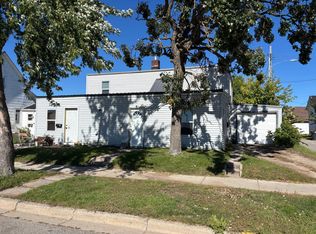 MLS ID #7037907, Amy Mattfield, Edina Realty, Inc.. NorthstarMLS as distributed by MLS GRID
- $239,9003 bd2 ba1.3k sqft121 Merle Ct NE, Bemidji, MN 56601For Sale
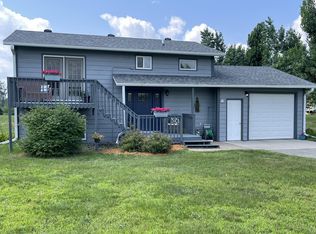 MLS ID #7117858, Diana Pederson, Grimes Realty. NorthstarMLS as distributed by MLS GRID
- $254,9004 bd2 ba2.1k sqft1301 Beltrami Ave NW, Bemidji, MN 56601For SaleMLS ID #7116139, Robert Elliott, Grimes Realty. NorthstarMLS as distributed by MLS GRID
- $195,0004 bd2 ba2.3k sqft3911 Alder St NE, Bemidji, MN 56601For SaleMLS ID #7031911, Mitchell Hill, Realty Experts, LLC. NorthstarMLS as distributed by MLS GRID
- $329,9004 bd2 ba2k sqft4437 Scotchpine Ct NW, Bemidji, MN 56601For SaleMLS ID #7114398, Robert Elliott, Grimes Realty. NorthstarMLS as distributed by MLS GRID
- $239,5003 bd2 ba1.8k sqft216 Stoner Ave SE, Bemidji, MN 56601For SaleMLS ID #7141868, Lisa Engman, Lake-N-Woods Realty. NorthstarMLS as distributed by MLS GRID
- $262,8003 bd2 ba1.1k sqft2101 Frohn Rd NE, Bemidji, MN 56601For SaleMLS ID #7128812, Team Montgomery, 218 Real Estate. NorthstarMLS as distributed by MLS GRID
- $272,0003 bd2 ba1.1k sqft6809 Hamilton Park NW #10, Bemidji, MN 56601For SaleMLS ID #7155143, James Preiner, Coldwell Banker Crown Realtors. NorthstarMLS as distributed by MLS GRID
- $299,7503 bd2 ba2k sqft102 Robertson Dr NW, Bemidji, MN 56601For SaleMLS ID #7084073, Jason Braunhausen, 218 Real Estate. NorthstarMLS as distributed by MLS GRID
- $364,8003 bd2 ba2.2k sqft14257 Puposky Rd NW, Bemidji, MN 56601For SaleMLS ID #7133377, Darren Ufford, 218 Real Estate. NorthstarMLS as distributed by MLS GRID
- $249,0003 bd2 ba1.3k sqft328 Gould Ave SE, Bemidji, MN 56601For SaleMLS ID #7136915, Donald Pearson, Edina Realty, Inc.. NorthstarMLS as distributed by MLS GRID
- $334,9003 bd2 ba1.5k sqft7775 Cardinal Rd NW, Bemidji, MN 56601For SaleMLS ID #7115919, Nicholas Johnson, 218 Real Estate. NorthstarMLS as distributed by MLS GRID
- $217,5006 bd3 ba2.5k sqft1001 Mississippi Ave NW, Bemidji, MN 56601For SaleMLS ID #7122336, Carissa Martin, Grimes Realty. NorthstarMLS as distributed by MLS GRID
- $219,0003 bd1 ba1.6k sqft2311 Birchmont Dr NE, Bemidji, MN 56601For SaleMLS ID #7134754, Mark Dickinson, Century 21 Dickinson. NorthstarMLS as distributed by MLS GRID
- $209,9003 bd2 ba1.1k sqft210 24th St NE, Bemidji, MN 56601For SaleMLS ID #7142178, Douglas Fuller, Better Homes and Gardens Real Estate First Choice. NorthstarMLS as distributed by MLS GRID
- $250,0003 bd2 ba1.3k sqft1707 Crosby Ct SE Lot 21, Bemidji, MN 56601For SaleMLS ID #7063701, Bill Oakes, Century 21 Dickinson. NorthstarMLS as distributed by MLS GRID
