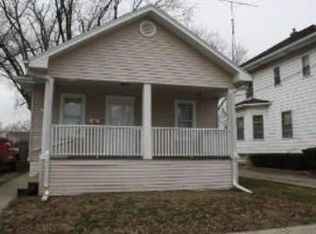
$75,500
3 bd|1 ba|1.4k sqft
860 N 5th Ave, Kankakee, IL 60901
Off Market
Zillow last checked:
James Martinez 312-718-5875,
Core Realty & Investments Inc.
Not available
Estimated sales range
Not available
Not available
| Date | Event | Price |
|---|---|---|
| 11/10/2025 | Sold | $50,000-23.1%$33/sqft |
Source: | ||
| 11/5/2025 | Pending sale | $65,000$43/sqft |
Source: | ||
| 10/27/2025 | Contingent | $65,000$43/sqft |
Source: | ||
| 10/10/2025 | Listed for sale | $65,000+66.7%$43/sqft |
Source: | ||
| 6/30/2021 | Listing removed | -- |
Source: Real Living Real Estate Report a problem | ||
| 10/28/2020 | Pending sale | $39,000$26/sqft |
Source: | ||
| 9/22/2020 | Listing removed | $900$1/sqft |
Source: Real Living Speckman Realty, Inc. #10835823 Report a problem | ||
| 8/26/2020 | Listed for rent | $900$1/sqft |
Source: Speckman Realty Real Living #10835823 Report a problem | ||
| 5/25/2020 | Price change | $39,000-12.4%$26/sqft |
Source: Real Living Speckman Realty, Inc. #10479162 Report a problem | ||
| 1/31/2020 | Price change | $44,500-18.9%$30/sqft |
Source: Real Living Speckman Realty, Inc. #10479162 Report a problem | ||
| 10/22/2019 | Price change | $54,900-8.3%$37/sqft |
Source: Speckman Realty Real Living #10479162 Report a problem | ||
| 8/8/2019 | Listed for sale | $59,900+698.7%$40/sqft |
Source: Speckman Realty Real Living #10479162 Report a problem | ||
| 8/26/2005 | Sold | $7,500$5/sqft |
Source: Public Record Report a problem | ||
| Year | Property taxes | Tax assessment |
|---|---|---|
| 2024 | $3,688 +3.8% | $31,192 +12.2% |
| 2023 | $3,553 +7.5% | $27,788 +14.3% |
| 2022 | $3,305 +6% | $24,322 +10.5% |
| 2021 | $3,119 +7.8% | $22,011 +11.3% |
| 2020 | $2,894 +4.9% | $19,785 +7.5% |
| 2019 | $2,758 +44.9% | $18,405 +8% |
| 2018 | $1,904 | $17,042 +2.2% |
| 2017 | $1,904 +7.9% | $16,667 +2% |
| 2016 | $1,764 +2.3% | $16,340 -2% |
| 2015 | $1,724 | $16,673 -5% |
| 2014 | $1,724 | $17,551 -13.6% |
| 2013 | -- | $20,314 -4.5% |
| 2012 | -- | $21,274 -7.6% |
| 2011 | -- | $23,036 -6.4% |
| 2009 | $2,126 +4.9% | $24,614 |
| 2008 | $2,028 | $24,614 +19.4% |
| 2002 | -- | $20,615 +2.1% |
| 2001 | -- | $20,193 |
| 2000 | -- | $20,193 |
Find assessor info on the county website
Source: MRED as distributed by MLS GRID. This data may not be complete. We recommend contacting the local school district to confirm school assignments for this home.
A local agent can set up tours, give advice and negotiate with sellers.
A local lender can help you make sure your offer is ready when you are.