Short Sale, 5BD,3BATH nice home for a large family.DO NOT DISTURB OCCUPANTS.submit offer subject to inspection.
Pre-foreclosure
Est. $1,518,400
849 Black Walnut Way, Morgan Hill, CA 95037
5beds
3baths
2,479sqft
SingleFamily
Built in 1995
0.33 Acres Lot
$1,518,400 Zestimate®
$613/sqft
$-- HOA
Overview
- 95 days
- 34
- 4
Facts & features
Interior
Bedrooms & bathrooms
- Bedrooms: 5
- Bathrooms: 3
Heating
- Other
Interior area
- Total interior livable area: 2,479 sqft
Property
Parking
- Parking features: Garage - Attached
Lot
- Size: 0.33 Acres
Details
- Parcel number: 72618057
Construction
Type & style
- Home type: SingleFamily
Materials
- wood frame
- Roof: Other
Condition
- Year built: 1995
Community & HOA
Location
- Region: Morgan Hill
Financial & listing details
- Price per square foot: $613/sqft
- Tax assessed value: $1,192,812
Foreclosure details
Estimated market value
$1,518,400
$1.40M - $1.64M
$5,181/mo
Price history
| Date | Event | Price |
|---|---|---|
| 3/1/2013 | Listing removed | $749,900$303/sqft |
Source: Realty World Northern California & Nevada #81233068 Report a problem | ||
| 9/27/2012 | Listed for sale | $749,900+102.7%$303/sqft |
Source: RealtyWorld Powerhouse Brokers #81233068 Report a problem | ||
| 9/23/2005 | Sold | $370,000-55.2%$149/sqft |
Source: Public Record Report a problem | ||
| 11/24/2004 | Sold | $825,000+85.4%$333/sqft |
Source: Public Record Report a problem | ||
| 2/27/1998 | Sold | $445,000+358.8%$180/sqft |
Source: Public Record Report a problem | ||
| 10/31/1997 | Sold | $97,000-73.8%$39/sqft |
Source: Public Record Report a problem | ||
| 3/15/1996 | Sold | $370,000$149/sqft |
Source: Public Record Report a problem | ||
Public tax history
| Year | Property taxes | Tax assessment |
|---|---|---|
| 2026 | -- | $1,192,812 +2% |
| 2025 | $13,376 +1.9% | $1,169,425 +2% |
| 2024 | $13,127 +1.3% | $1,146,496 +2% |
| 2023 | $12,959 +1.7% | $1,124,017 +2% |
| 2022 | $12,742 +2.6% | $1,101,979 +2% |
| 2021 | $12,423 +2.5% | $1,080,372 +1% |
| 2020 | $12,122 | $1,069,295 +2% |
| 2019 | $12,122 -3.1% | $1,048,329 +2% |
| 2018 | $12,508 | $1,027,774 +2% |
| 2017 | $12,508 +0.9% | $1,007,622 +2% |
| 2016 | $12,391 +27.1% | $987,866 +19.8% |
| 2015 | $9,752 +2.3% | $824,700 +6% |
| 2014 | $9,529 | $778,000 +35.1% |
| 2013 | -- | $576,000 +0.3% |
| 2012 | -- | $574,000 -5% |
| 2011 | -- | $604,000 -8.9% |
| 2010 | -- | $663,000 -27% |
| 2009 | -- | $908,128 +2% |
| 2008 | -- | $890,322 +2% |
| 2007 | -- | $872,865 +2% |
| 2006 | -- | $855,750 +3.7% |
| 2005 | -- | $825,000 +65.2% |
| 2004 | -- | $499,481 +1.9% |
| 2003 | -- | $490,328 +2% |
| 2002 | -- | $480,715 +2% |
| 2001 | -- | $471,290 |
Find assessor info on the county website
Monthly payment
Climate risks
Neighborhood: 95037
- $1,646,0005 bd3 ba3.2k sqft845 Black Walnut Way, Morgan Hill, CA 95037Off Market
- $2,300,0004 bd4 ba2.6k sqft865 Black Walnut Ct, Morgan Hill, CA 95037Sold

- $1,999,9995 bd4 ba3.5k sqft844 Black Walnut Way, Morgan Hill, CA 95037For Sale
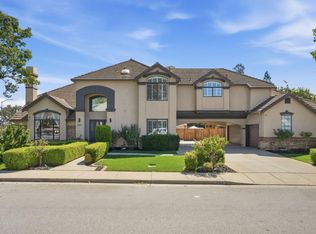
- $1,790,1005 bd3 ba3.2k sqft841 Black Walnut Way, Morgan Hill, CA 95037Off Market

Similar homes
- $1,800,0004 bd5 ba3.5k sqft870 Serene Ct, Morgan Hill, CA 95037For Sale
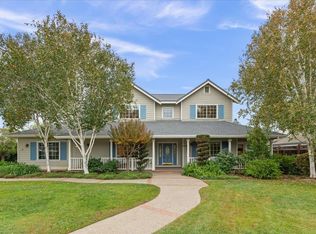 MLS ID #ML82066922, Jen Marley. MLSListings Inc
- $1,399,0004 bd3 ba2.2k sqft17387 Walnut Grove Dr, Morgan Hill, CA 95037For Sale
 MLS ID #ML82061203, Terry Jarrouche. MLSListings Inc
- $1,399,0004 bd2 ba1.8k sqft16900 Sundance Dr, Morgan Hill, CA 95037For Sale
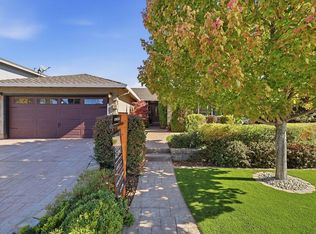 MLS ID #ML82066421, Debbie Adamo. MLSListings Inc
- $1,699,0004 bd3 ba2.4k sqft17205 Rosemary Cir, Morgan Hill, CA 95037For Sale
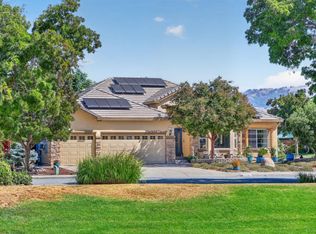 MLS ID #ML82065196, Kelley Solberg. MLSListings Inc
