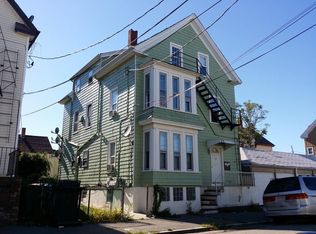
Renovated Three Family with off-street parking and a good sized backyard. First floor and second floor apartments have brand new white shaker cabinets with soft close doors, granite countertops, vinyl waterproof flooring and stainless steel appliances. First floor has a renovated bathroom with all new fixtures and tiled tub and shower surround. Roof was replaced about 10 years ago. First and second floor apartments have been freshly painted throughout with modern grey colors. Basement, front and back hallways have also been freshly painted. First and second floor apartments are vacant and the third floor is occupied with a tenant at will.
Pending
$499,900
9 Cleveland St, New Bedford, MA 02744
6beds
1,925sqft
3 Family - 3 Units Up/Down
Built in 1897
-- sqft lot
$584,900 Zestimate®
$260/sqft
$-- HOA
What's special
- 54 days
- 5
- 0
Zillow last checked:
Listing updated:
Listed by:
Jermaine A. Hurley 774-930-5694,
Cameron Real Estate Group 781-486-3180,
Jermaine A. Hurley 774-930-5694
Source: MLS PIN,MLS#: 73337430
Facts & features
Interior
Bedrooms & bathrooms
- Bedrooms: 6
- Bathrooms: 3
- Full bathrooms: 3
Features
- Flooring: Vinyl
- Basement: Full
- Has fireplace: No
Interior area
- Total structure area: 1,925
- Total interior livable area: 1,925 sqft
- Finished area above ground: 1,925
Property
Parking
- Total spaces: 3
- Parking features: Paved Drive, Off Street
- Uncovered spaces: 3
Features
- Patio & porch: Porch, Deck
- Waterfront features: 1 to 2 Mile To Beach
Lot
- Size: 3,202 Square Feet
Details
- Parcel number: 2884703
- Zoning: RC
Construction
Type & style
- Home type: MultiFamily
- Property subtype: 3 Family - 3 Units Up/Down
Materials
- Frame
- Foundation: Stone
- Roof: Shingle
Condition
- Year built: 1897
Utilities & green energy
- Electric: Circuit Breakers
- Sewer: Public Sewer
- Water: Public
- Utilities for property: for Gas Range
Community & HOA
Location
- Region: New Bedford
Financial & listing details
- Price per square foot: $260/sqft
- Tax assessed value: $310,000
- Annual tax amount: $3,720
- Date on market: 9/12/2026
- Listing terms: Contract
- Total actual rent: 0
Estimated market value
$584,900
Estimated sales range
Not available
$1,897/mo
Price history
| Date | Event | Price |
|---|---|---|
| 9/23/2026 | Pending sale | $499,900$260/sqft |
Source: MLS PIN #73337430 Report a problem | ||
| 2/22/2025 | Listed for sale | $499,900+334.7%$260/sqft |
Source: MLS PIN #73337430 Report a problem | ||
| 7/11/2013 | Listing removed | $115,000$60/sqft |
Source: Century 21 Signature Properties #71432899 Report a problem | ||
| 7/7/2013 | Listed for sale | $115,000$60/sqft |
Source: Century 21 Signature Properties #71432899 Report a problem | ||
| 5/9/2013 | Listing removed | $115,000$60/sqft |
Source: Century 21 Signature Properties #71432899 Report a problem | ||
| 9/11/2012 | Listed for sale | $115,000+35.3%$60/sqft |
Source: Century 21 Hughes & Carey #71432899 Report a problem | ||
| 9/8/2009 | Sold | $85,000-34.6%$44/sqft |
Source: Public Record Report a problem | ||
| 3/23/2009 | Listing removed | $129,900$67/sqft |
Source: NCI #70878893 Report a problem | ||
| 2/26/2009 | Listed for sale | $129,900-27.8%$67/sqft |
Source: NCI #70878893 Report a problem | ||
| 6/30/2003 | Sold | $179,900$93/sqft |
Source: Public Record Report a problem | ||
Public tax history
| Year | Property taxes | Tax assessment |
|---|---|---|
| 2025 | $4,228 +13.7% | $373,800 +20.6% |
| 2024 | $3,720 +8.9% | $310,000 +29.7% |
| 2023 | $3,417 +13.9% | $239,100 +23.8% |
| 2022 | $3,001 +2.1% | $193,100 +2.4% |
| 2021 | $2,940 +2.3% | $188,600 +6% |
| 2020 | $2,875 +13.8% | $177,900 +16% |
| 2019 | $2,526 +4.4% | $153,400 +5.4% |
| 2018 | $2,420 +6.9% | $145,500 +7.3% |
| 2017 | $2,263 +2.4% | $135,600 +1.2% |
| 2016 | $2,210 +5.5% | $134,000 +0.7% |
| 2015 | $2,094 +3.8% | $133,100 |
| 2014 | $2,018 -4.5% | $133,100 -9.7% |
| 2013 | $2,112 -0.7% | $147,400 -4.7% |
| 2012 | $2,127 -3.5% | $154,600 -9.6% |
| 2011 | $2,204 -13.1% | $171,100 -18.8% |
| 2010 | $2,535 +2.2% | $210,700 -2.8% |
| 2009 | $2,481 +5.7% | $216,700 -2.6% |
| 2008 | $2,347 +1.5% | $222,500 -0.8% |
| 2007 | $2,313 +15.3% | $224,300 +21.6% |
| 2006 | $2,006 +2% | $184,500 +6.6% |
| 2005 | $1,967 +6.4% | $173,000 +15.8% |
| 2004 | $1,848 +40.1% | $149,400 +66% |
| 2003 | $1,319 +6.3% | $90,000 +11.8% |
| 2002 | $1,241 -0.2% | $80,500 +5.1% |
| 2000 | $1,243 +25.4% | $76,600 +2.5% |
| 1996 | $991 | $74,700 |
Find assessor info on the county website
Monthly payment
Est. payment
Payment breakdown
Explore the cost of this home by adjusting the details. Changes won't be saved.Climate risks
Neighborhood: 02744

Similar homes
- $475,0006 bd2 ba2k sqft17 Social St, New Bedford, MA 02744For Sale
 MLS ID #73546783, Christine Do, Keller Williams Realty. MLS PIN
- $475,0006 bd3 ba1.8k sqft1272 Pleasant St, New Bedford, MA 02740For Sale
 MLS ID #73598989, Josiah Cordero, RE/MAX Vantage. MLS PIN
- $484,9006 bd2 ba1.9k sqft84 Walden St, New Bedford, MA 02740For Sale
 MLS ID #73596685, Lentini Tavares, Vicente Realty, LLC. MLS PIN
- $639,0006 bd2 ba2.1k sqft96-98 Clara St, New Bedford, MA 02744For Sale
 MLS ID #73593689, Catherine Hearn, Gibson Sotheby's International Realty. MLS PIN
