Triplex unit on quarter of an acre in a court location.
Active
$549,000
9015 Sherill Ct, Stockton, CA 95209
7beds
3,152sqft
Duplex
Built in 1978
-- sqft lot
$540,700 Zestimate®
$174/sqft
$-- HOA
What's special
Court locationQuarter of an acre
- 23 days
- 413
- 21
Likely to sell faster than
Zillow last checked:
Listing updated:
Listed by:
Renee Saenz DRE #01357353 209-814-8821,
KW Central Valley
Source: MetroList Services of CA,MLS#: 226131294Originating MLS: MetroList Services, Inc.
Facts & features
Interior
Bedrooms & bathrooms
- Bedrooms: 7
- Bathrooms: 4
- Full bathrooms: 4
Heating
- Central
Cooling
- Central Air
Appliances
- Laundry: Washer/Dryer Hookups
Features
- Flooring: Carpet
- Has fireplace: No
Interior area
- Total interior livable area: 3,152 sqft
Property
Parking
- Total spaces: 3
- Parking features: Uncovered
- Garage spaces: 3
- Has uncovered spaces: Yes
Lot
- Size: 0.29 Acres
- Features: Court
Details
- Parcel number: 072410060000
- Zoning: Residential
- Special conditions: Trust
Construction
Type & style
- Home type: MultiFamily
- Property subtype: Duplex
Materials
- Wood
- Foundation: Slab
Condition
- Year built: 1978
Utilities & green energy
- Sewer: Public Sewer
- Water: Public
- Utilities for property: Electric
Community & HOA
Location
- Region: Stockton
Financial & listing details
- Price per square foot: $174/sqft
- Tax assessed value: $237,559
- Price range: $549K - $549K
- Date on market: 10/24/2026
- Income includes: Rent Only, See Remarks
Estimated market value
$540,700
$514,000 - $568,000
$2,008/mo
Price history
| Date | Event | Price |
|---|---|---|
| 10/24/2026 | Listed for sale | $549,000+188.9%$174/sqft |
Source: MetroList Services of CA #226131294 Report a problem | ||
| 3/17/2014 | Sold | $190,000+8.6%$60/sqft |
Source: Public Record Report a problem | ||
| 1/16/2013 | Listing removed | $650 |
Source: Hotpads for Rent Report a problem | ||
| 12/22/2012 | Listed for rent | $650 |
Source: Hotpads for Rent Report a problem | ||
| 5/22/2012 | Listing removed | $650 |
Source: Starr Property Management Inc. Report a problem | ||
| 2/22/2012 | Listed for rent | $650 |
Source: Starr Property Management Inc. Report a problem | ||
| 12/9/2011 | Sold | $175,000+128.8%$56/sqft |
Source: Public Record Report a problem | ||
| 1/21/2011 | Sold | $76,500-76.5%$24/sqft |
Source: Public Record Report a problem | ||
| 5/26/2010 | Sold | $326,054-19.5%$103/sqft |
Source: Public Record Report a problem | ||
| 10/21/2004 | Sold | $405,000+9.5%$128/sqft |
Source: Public Record Report a problem | ||
| 6/18/2004 | Sold | $370,000+640%$117/sqft |
Source: Public Record Report a problem | ||
| 3/27/1998 | Sold | $50,000-30.6%$16/sqft |
Source: Public Record Report a problem | ||
| 9/6/1996 | Sold | $72,000$23/sqft |
Source: Public Record Report a problem | ||
Public tax history
| Year | Property taxes | Tax assessment |
|---|---|---|
| 2026 | -- | $237,559 +2% |
| 2025 | $2,709 +1.9% | $232,902 +2% |
| 2024 | $2,659 +1.2% | $228,337 +2% |
| 2023 | $2,628 +3.9% | $223,860 +2% |
| 2022 | $2,529 -2.2% | $219,472 +2% |
| 2021 | $2,586 +2.4% | $215,170 +1% |
| 2020 | $2,524 +2.3% | $212,965 +2% |
| 2019 | $2,467 +1.8% | $208,790 +2% |
| 2018 | $2,423 +2.4% | $204,697 +2% |
| 2017 | $2,366 +6.1% | $200,685 +2% |
| 2016 | $2,231 +7.3% | $196,751 +1.5% |
| 2015 | $2,078 | $193,796 +8.1% |
| 2014 | $2,078 | $179,310 +0.5% |
| 2013 | -- | $178,500 +2% |
| 2012 | -- | $175,000 +52.4% |
| 2011 | -- | $114,859 +0.8% |
| 2010 | -- | $114,000 -54.4% |
| 2009 | -- | $250,000 -41.8% |
| 2008 | -- | $429,786 +2% |
| 2007 | -- | $421,362 +2% |
| 2006 | -- | $413,100 +2% |
| 2005 | -- | $405,000 +621.2% |
| 2004 | -- | $56,153 +1.9% |
| 2003 | -- | $55,123 +4% |
| 2002 | -- | $52,983 |
| 2001 | -- | $52,983 |
Find assessor info on the county website
Monthly payment
Est. payment
Payment breakdown
Explore the cost of this home by adjusting the details. Changes won't be saved.Climate risks
Neighborhood: Stonewood
Similar homes
- $499,0006 bd4 ba2.2k sqft1951-1953 Colt Dr, Stockton, CA 95209For Sale
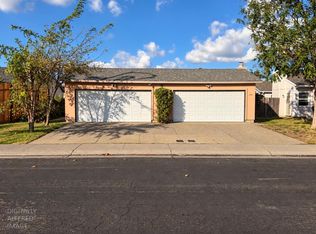 MLS ID #226131082, Renee Saenz. MetroList Services of CA
- $574,0006 bd4 ba2.7k sqft2646 Plantation Pl, Stockton, CA 95209For Sale
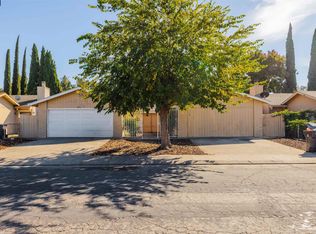 MLS ID #41147845, Lynn Alatab. CCAR
- $689,0007 bd6 ba2.9k sqft9555 Bancroft Way, Stockton, CA 95209For Sale
 MLS ID #226137542, Jeff Dolen. MetroList Services of CA
- $540,0006 bd4 ba2.2k sqft9531-9533 Bancroft Way, Stockton, CA 95209For Sale
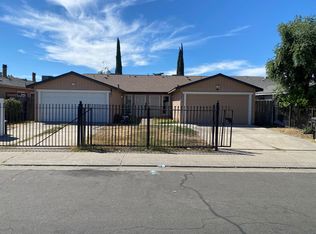 MLS ID #226114340, Mazhar Khan. MetroList Services of CA
