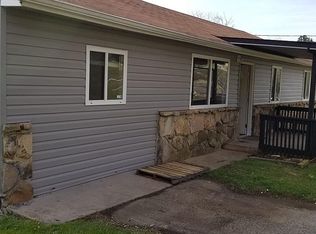
Welcome to this charming, move-in-ready 3-bedroom, 2-bath home featuring a variety of recent improvements. Fresh paint, new flooring in one bedroom, and refreshed bathrooms with attractive tile floors give the interior an updated feel. One bathroom includes a convenient walk-in shower, while a newly installed heat pump and updated electrical breakers provide added peace of mind. Ideally situated in Morristown near schools, shopping, and everyday conveniences, this home offers a great combination of comfort and practical updates. Whether you're purchasing your first home or looking for a property you can settle into right away, this one is worth a look!
For sale
$255,900
910 Lloyd St, Morristown, TN 37814
3beds
1,734sqft
Single Family Residence, Residential
Built in 1971
0.27 Acres Lot
$248,200 Zestimate®
$148/sqft
$-- HOA
What's special
Fresh paintRecent improvementsNewly installed heat pumpUpdated electrical breakers
- 7 days
- 496
- 22
Zillow last checked:
Listing updated:
Listed by:
Leander W Deguise 423-353-3910,
Dalton Wade, Inc
Source: Lakeway Area AOR,MLS#: 713286
Facts & features
Interior
Bedrooms & bathrooms
- Bedrooms: 3
- Bathrooms: 2
- Full bathrooms: 2
Heating
- Heat Pump
Cooling
- Central Air, Heat Pump
Features
- Has basement: No
- Has fireplace: No
Interior area
- Total interior livable area: 1,734 sqft
- Finished area above ground: 1,734
- Finished area below ground: 0
Property
Lot
- Size: 0.27 Acres
- Dimensions: 178 x 78 x 144 x 54 x 25
Details
- Parcel number: 034B A 03400 000
Construction
Type & style
- Home type: SingleFamily
- Property subtype: Single Family Residence, Residential
Condition
- New construction: No
- Year built: 1971
Community & HOA
HOA
- Has HOA: No
Location
- Region: Morristown
Financial & listing details
- Price per square foot: $148/sqft
- Tax assessed value: $168,500
- Annual tax amount: $948
- Date on market: 10/13/2026
Estimated market value
$248,200
$236,000 - $261,000
$1,816/mo
Price history
| Date | Event | Price |
|---|---|---|
| 10/13/2026 | Listed for sale | $255,900-6.9%$148/sqft |
Source:  Lakeway Area AOR #713286 Report a problem | ||
| 7/22/2026 | Listing removed | $274,900$159/sqft |
Source: My State MLS #11801869 Report a problem | ||
| 7/2/2026 | Price change | $274,9000%$159/sqft |
Source: My State MLS #11801869 Report a problem | ||
| 6/25/2026 | Price change | $274,9090%$159/sqft |
Source:  GSMAR, GSMMLS #312230 Report a problem | ||
| 6/18/2026 | Price change | $274,9900%$159/sqft |
Source: My State MLS #11801869 Report a problem | ||
| 6/5/2026 | Listed for sale | $274,999+3.8%$159/sqft |
Source: My State MLS #11801869 Report a problem | ||
| 12/29/2025 | Listing removed | $265,000$153/sqft |
Source: Lakeway Area AOR #709315 Report a problem | ||
| 11/4/2025 | Price change | $265,000-11.4%$153/sqft |
Source: Lakeway Area AOR #709315 Report a problem | ||
| 10/13/2025 | Listed for sale | $299,000+360%$172/sqft |
Source: Lakeway Area AOR #709315 Report a problem | ||
| 3/24/2021 | Listing removed | -- |
Source: Owner Report a problem | ||
| 11/22/2017 | Sold | $65,000-27.8%$37/sqft |
Source: Public Record Report a problem | ||
| 9/29/2016 | Listing removed | $90,000$52/sqft |
Source: Owner Report a problem | ||
| 7/1/2016 | Listed for sale | $90,000$52/sqft |
Source: Owner Report a problem | ||
| 7/26/2015 | Listing removed | $90,000$52/sqft |
Source: Owner Report a problem | ||
| 12/29/2014 | Listed for sale | $90,000$52/sqft |
Source: Owner Report a problem | ||
| 8/24/2014 | Listing removed | $90,000$52/sqft |
Source: Owner Report a problem | ||
| 5/26/2014 | Listed for sale | $90,000+114.3%$52/sqft |
Source: Owner Report a problem | ||
| 12/8/2011 | Sold | $42,000-22.2%$24/sqft |
Source: Public Record Report a problem | ||
| 9/2/2011 | Listed for sale | $54,000-66.6%$31/sqft |
Source: isNowListed.com Report a problem | ||
| 8/22/2011 | Sold | $161,697+127.7%$93/sqft |
Source: Public Record Report a problem | ||
| 12/1/1999 | Sold | $71,000$41/sqft |
Source: Public Record Report a problem | ||
Public tax history
| Year | Property taxes | Tax assessment |
|---|---|---|
| 2025 | $949 +39% | $42,125 +95% |
| 2024 | $683 | $21,600 |
| 2023 | $683 | $21,600 |
| 2022 | $683 | $21,600 |
| 2021 | $683 +0.1% | $21,600 |
| 2020 | $682 +0.1% | $21,600 +7.9% |
| 2019 | $681 +7.9% | $20,025 |
| 2018 | $631 +66% | $20,025 |
| 2017 | $380 | $20,025 |
| 2016 | $380 -31.1% | $20,025 |
| 2015 | $551 | $20,025 |
| 2014 | -- | $20,025 -15.2% |
| 2013 | -- | $23,625 |
| 2011 | $636 | $23,625 |
| 2010 | $636 | $23,625 |
| 2009 | -- | $23,625 +17.8% |
| 2008 | $634 -4.5% | $20,050 |
| 2007 | $664 +17.8% | $20,050 |
| 2006 | $563 | $20,050 |
| 2005 | $563 -10.8% | $20,050 |
| 2004 | $632 +37.6% | $20,050 +37.6% |
| 2003 | $459 | $14,575 |
| 2001 | -- | $14,575 -75% |
| 2000 | -- | $58,301 |
Find assessor info on the county website
Monthly payment
Est. payment
Payment breakdown
Explore the cost of this home by adjusting the details. Changes won't be saved.Climate risks
Neighborhood: 37814

Similar homes
- $250,0003 bd2 ba910 sqft322 Gilbert St, Morristown, TN 37814For Sale

 MLS ID #712479, Nichole Raimondi, Crye-Leike Premier Real Estate LLC. Lakeway Area AOR
- $249,0003 bd1 ba1.2k sqft1201 McFarland St, Morristown, TN 37814For Sale

 MLS ID #3314645, Jennifer Jackson. RealTracs MLS as distributed by MLS GRID
- $299,0003 bd2 ba1.8k sqft4086 White Wood Cir, Morristown, TN 37814For Sale
 MLS ID #712758, Ben Taylor Cantwell, Greater Impact Realty Lakeway. Lakeway Area AOR
- $219,9003 bd1 ba912 sqft1327 Carmichael St, Morristown, TN 37814For Sale
 MLS ID #713177, Jennifer Kelkowski, Greater Impact Realty Lakeway. Lakeway Area AOR
- $295,0003 bd2 ba2k sqft743 Jaybird Rd, Morristown, TN 37814For SaleMLS ID #712762, Sarah Richards, Spring Mountain Realty, PLLC. Lakeway Area AOR
- $209,9003 bd1 ba1.1k sqft1234 Urban Dr, Morristown, TN 37813For SaleMLS ID #713344, Greta Clark, Castle & Associates Real Estate. Lakeway Area AOR
- $299,9003 bd2 ba1.2k sqft1430 Madison St, Morristown, TN 37814For SaleMLS ID #3312275, Felix Ordaz. RealTracs MLS as distributed by MLS GRID
- $299,9003 bd2 ba1.7k sqft460 Ash St, Morristown, TN 37813For SaleMLS ID #713141, Peggy Smelcer, Broyles Real Estate & Auction. Lakeway Area AOR
- $320,0003 bd2 ba1.9k sqft2737 Conrad Dr, Morristown, TN 37814For SaleMLS ID #3512976, Sarah Williams. RealTracs MLS as distributed by MLS GRID
- $349,9003 bd2 ba2k sqft4335 Brockwood Dr, Morristown, TN 37813For SaleMLS ID #713302, Austin Pratt, Elite Realty Group. Lakeway Area AOR
- $242,9004 bd2 ba1.5k sqft2132 Pryors Passing, Morristown, TN 37813Active
 MLS ID #1345695, Missy Sanders, Stephenson Realty & Auction. East Tennessee Realtors
- $225,0005 bd2 ba2k sqft303 E Louise Ave, Morristown, TN 37813For SaleMLS ID #3210893, Steven Paul. RealTracs MLS as distributed by MLS GRID
- $309,9003 bd2 ba2k sqft2686 Lakemont Cir, Morristown, TN 37814For SaleMLS ID #711980, Robin Epps, Crye-Leike Lakeway Real Estate. Lakeway Area AOR
- $200,0003 bd1 ba960 sqft3839 Reeds Chapel Rd, Morristown, TN 37814For SaleMLS ID #711449, Karen Breeding, RE/MAX Real Estate Ten Midtown. Lakeway Area AOR
- $350,0003 bd2 ba2.4k sqft2310 Quentin Cir, Morristown, TN 37814For SaleMLS ID #712792, Margie Wright, Wright Property Marketing Group. Lakeway Area AOR
- $259,9004 bd2 ba1.7k sqft688 Rocky Summit Rd, Bean Station, TN 37708For SaleMLS ID #712951, Lisa McBride, Clinch Mountain Realty & Auction. Lakeway Area AOR
- $319,9003 bd3 ba1.3k sqft600 Spruce St, Morristown, TN 37813For SaleMLS ID #712987, Matt Daniels, Crye-Leike Premier Real Estate LLC. Lakeway Area AOR
- $325,0003 bd2 ba1.4k sqft1241 Taylor Rd, Morristown, TN 37814For SaleMLS ID #712317, Amy Shrader, RE/MAX Real Estate Ten Midtown. Lakeway Area AOR
- $215,9003 bd2 ba1.1k sqft1487 Shields Ferry Rd, Morristown, TN 37814ActiveMLS ID #1344998, Ashleigh Ferrebee, Keller Williams Realty. East Tennessee Realtors
