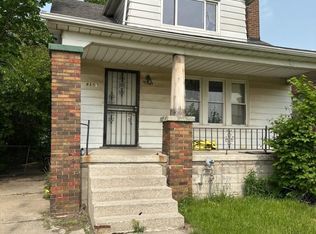
TURN KEY RENTAL. 3 BED, 1 BATH WITH A TENANT IN PLACE ON A 12-MONTH LEASE AT $1,250/MONTH. BUY IT, KEEP THE TENANT, AND COLLECT RENT AT CLOSING. LEASE TRANSFERS TO BUYER. SHOWINGS BY APPOINTMENT ONLY. PLEASE DO NOT DISTURB TENANT.
For sale
$99,900
9365 Birwood St, Detroit, MI 48204
3beds
2,234sqft
Single Family Residence
Built in 1940
4,791 Square Feet Lot
$-- Zestimate®
$45/sqft
$-- HOA
What's special
- 33 days
- 270
- 41
Zillow last checked:
Listing updated:
Listed by:
Mohamad Dakhlallah 313-395-0000,
Own It Realty 313-395-0000
Source: Realcomp II,MLS#: 20261076250
Facts & features
Interior
Bedrooms & bathrooms
- Bedrooms: 3
- Bathrooms: 1
- Full bathrooms: 1
Primary bedroom
- Level: Second
- Area: 130
- Dimensions: 13 X 10
Bedroom
- Level: Entry
- Area: 80
- Dimensions: 10 X 8
Bedroom
- Level: Entry
- Area: 100
- Dimensions: 10 X 10
Other
- Level: Entry
- Area: 72
- Dimensions: 9 X 8
Heating
- Forced Air, Natural Gas
Features
- Basement: Finished,Full
- Has fireplace: No
Interior area
- Total interior livable area: 2,234 sqft
- Finished area above ground: 1,224
- Finished area below ground: 1,010
Property
Parking
- Total spaces: 1
- Parking features: One Car Garage, Detached
- Garage spaces: 1
Features
- Levels: One And One Half
- Stories: 1.5
- Entry location: GroundLevelwSteps
- Pool features: None
Lot
- Size: 4,791 Square Feet
- Dimensions: 35 x 131.97
Details
- Parcel number: W18I016996S
- Special conditions: Short Sale No,Standard
Construction
Type & style
- Home type: SingleFamily
- Architectural style: Bungalow
- Property subtype: Single Family Residence
Materials
- Brick
- Foundation: Basement, Block
Condition
- New construction: No
- Year built: 1940
Utilities & green energy
- Sewer: Public Sewer
- Water: Public
Community & HOA
Community
- Subdivision: B E TAYLORS MIDDLEPOINT SUB
HOA
- Has HOA: No
Location
- Region: Detroit
Financial & listing details
- Price per square foot: $45/sqft
- Tax assessed value: $38,100
- Annual tax amount: $532
- Date on market: 10/9/2026
- Cumulative days on market: 33 days
- Listing agreement: Exclusive Right To Sell
- Listing terms: Cash,Conventional,FHA,Va Loan
Estimated market value
Not available
Estimated sales range
Not available
$1,460/mo
Price history
| Date | Event | Price |
|---|---|---|
| 10/9/2026 | Listed for sale | $99,900+222.3%$45/sqft |
Source:  Realcomp II #20261076250 Report a problem | ||
| 4/25/2026 | Listing removed | $1,250$1/sqft |
Source: Zillow Rentals Report a problem | ||
| 4/24/2026 | Listed for rent | $1,250$1/sqft |
Source: Zillow Rentals Report a problem | ||
| 4/23/2026 | Listing removed | $1,250$1/sqft |
Source: Zillow Rentals Report a problem | ||
| 4/1/2026 | Listed for rent | $1,250+4.2%$1/sqft |
Source: Zillow Rentals Report a problem | ||
| 3/24/2026 | Listing removed | $1,200$1/sqft |
Source: Zillow Rentals Report a problem | ||
| 2/27/2026 | Price change | $1,200-7.7%$1/sqft |
Source: Zillow Rentals Report a problem | ||
| 1/30/2026 | Price change | $1,300-7.1%$1/sqft |
Source: Zillow Rentals Report a problem | ||
| 1/21/2026 | Sold | $31,000+106.7%$14/sqft |
Source: Public Record Report a problem | ||
| 1/14/2026 | Listed for rent | $1,400$1/sqft |
Source: Zillow Rentals Report a problem | ||
| 11/23/2016 | Pending sale | $15,000$7/sqft |
Source: Keller Williams - Royal Oak #216101640 Report a problem | ||
| 10/16/2016 | Listed for sale | $15,000+200%$7/sqft |
Source: Keller Williams Royal Oak Market Center #216101640 Report a problem | ||
| 9/21/2009 | Sold | $5,000-40.5%$2/sqft |
Source: Public Record Report a problem | ||
| 6/20/2009 | Listed for sale | $8,400-91.3%$4/sqft |
Source: Visual Tour #29064902 Report a problem | ||
| 7/11/2008 | Sold | $96,477$43/sqft |
Source: Public Record Report a problem | ||
Public tax history
| Year | Property taxes | Tax assessment |
|---|---|---|
| 2025 | -- | $38,700 +53% |
| 2024 | -- | $25,300 +22.2% |
| 2023 | -- | $20,700 +24% |
| 2022 | -- | $16,700 +15.2% |
| 2021 | -- | $14,500 |
| 2020 | $1,782 +49.6% | $14,500 +33% |
| 2019 | $1,191 | $10,900 -0.9% |
| 2018 | $1,191 | $11,000 -9.1% |
| 2017 | -- | $12,100 -14.8% |
| 2016 | $1,993 | $14,200 |
| 2015 | $1,993 -14.5% | $14,200 -39% |
| 2013 | $2,330 +16.9% | $23,297 -30.2% |
| 2010 | $1,993 | $33,379 -12% |
| 2009 | -- | $37,931 -13.5% |
| 2008 | -- | $43,851 |
| 2007 | -- | $43,851 +5.5% |
| 2005 | $159 | $41,565 +3% |
| 2004 | -- | $40,354 |
Find assessor info on the county website
Monthly payment
Est. payment
Payment breakdown
Explore the cost of this home by adjusting the details. Changes won't be saved.Climate risks
Neighborhood: Barton-McFarland


Similar homes
- $89,9004 bd2 ba1.9k sqft9225 Birwood St, Detroit, MI 48204For Sale

 MLS ID #20261090629, James T Silver, Keller Williams Somerset. Realcomp II
- $--3 bd1 ba1.3k sqft8546 Indiana St, Detroit, MI 48204Auction
 Auction.com 4
- $120,0003 bd2 ba1.9k sqft9283 Birwood St, Detroit, MI 48204For Sale
 MLS ID #20261077997, Carolyn Wright, Keller Williams Realty-Great Lakes. Realcomp II
- $88,9003 bd2 ba1.3k sqft9241 Mendota St, Detroit, MI 48204For Sale
 MLS ID #20261080769, Kevin Griffin, Rondo Investment LLC. Realcomp II
- $99,0003 bd1 ba1.2k sqft10008 Manor St, Detroit, MI 48204For SaleMLS ID #20261020627, Osavbie Usenvbuwa, Century 21 Curran & Oberski. Realcomp II
- $89,0003 bd1 ba1.7k sqft10017 Manor St, Detroit, MI 48204For SaleMLS ID #20261077529, Nick Jaafar, Keller Williams Legacy. Realcomp II
- $89,0003 bd1 ba1.4k sqft12081 Santa Rosa Dr, Detroit, MI 48204For SaleMLS ID #20261088693, Anthony Vitale, Realty Executives Home Towne. Realcomp II
- $120,0003 bd2 ba1.3k sqft8259 Kentucky St, Detroit, MI 48204For SaleMLS ID #20261088687, Anthony Vitale, Realty Executives Home Towne. Realcomp II
- $99,0003 bd2 ba1.6k sqft6334 Tuxedo St, Detroit, MI 48204For SaleMLS ID #20261086957, Maricela Meza, Realty of America. Realcomp II
- $85,4005 bd2 ba1.8k sqft9164 Mendota St, Detroit, MI 48204For SaleMLS ID #20261061126, Greg Majewski, Detroit Investment Company. Realcomp II
- $100,0004 bd1 ba1.2k sqft9216 Decatur St, Detroit, MI 48228For SaleMLS ID #20261090430, Lawrence Else, Realtyflo Inc. Realcomp II
- $83,0004 bd1 ba1.2k sqft9400 Mendota St, Detroit, MI 48204For Sale
 MLS ID #26046228, Kristian Freiwald, Domus Realty. MichRIC
- $95,0003 bd1 ba1.2k sqft11725 Yellowstone St, Detroit, MI 48204For SaleMLS ID #20261062756, Antwuan M Hawkins, Five Star Luxury Realty. Realcomp II
- $105,0003 bd2 ba1.3k sqft13644 Castleton St, Detroit, MI 48227For SaleMLS ID #20261079282, Laura Bedoya, EXP Realty Main. Realcomp II
- $107,5004 bd2 ba2k sqft12481 Mendota St, Detroit, MI 48204For SaleMLS ID #20261070739, Benjamin Ness, Clyde Realty LLC. Realcomp II
- $99,9993 bd2 ba1.5k sqft6430 Majestic St, Detroit, MI 48210For SaleMLS ID #20261079368, Dominick Arafat, EXP Z Real Estate. Realcomp II
- $109,7003 bd1 ba1.8k sqft8949 Marlowe St, Detroit, MI 48228For SaleMLS ID #20261082689, Hanadi Kabbani, Empire Realty Group Fawaz & Associates. Realcomp II
- $98,0005 bd2 ba1.8k sqft12778 Meyers Rd, Detroit, MI 48227For SaleMLS ID #20261074699, Chad Apap, EXP Z Real Estate. Realcomp II
