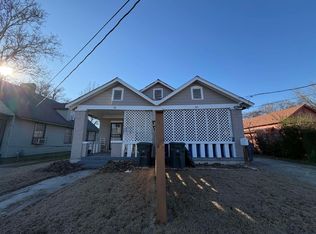
INVESTORS ONLY! Tenant occupied 3bed 2bath home currently rented for $1025/mo. Property was just rehabbed in September 2026. Professionally managed property. No sign in the yard. Please do not disturb or approach the tenant. NO SHOWINGS WITHOUT AN ACCEPTED OFFER. Seller also selling 3219 Choctaw Ave, and 4075 Westmont. No wholesalers, no assignments, no creative financing or subject to offers please.
For sale
$109,900
994 N 7th St, Memphis, TN 38107
3beds
1,556sqft
Single Family Residence
Built in 1910
5,662 Square Feet Lot
$106,700 Zestimate®
$71/sqft
$-- HOA
What's special
- 54 days
- 182
- 21
Zillow last checked:
Listing updated:
Listed by:
Tyler Tapley,
Crye-Leike, Inc., REALTORS 901-756-8900
Source: MAAR,MLS#: 10230186
Facts & features
Interior
Bedrooms & bathrooms
- Bedrooms: 3
- Bathrooms: 2
- Full bathrooms: 2
Primary bedroom
- Area: 100
- Dimensions: 10 x 10
Dining room
- Area: 100
- Dimensions: 10 x 10
Kitchen
- Features: Pantry
Living room
- Area: 100
- Dimensions: 10 x 10
Den
- Area: 100
- Dimensions: 10 x 10
Heating
- Central
Cooling
- Central Air
Features
- All Bedrooms Down, Square Feet Source: AutoFill (MAARdata) or Public Records (Cnty Assessor Site)
- Flooring: Tile
- Has fireplace: No
Interior area
- Total interior livable area: 1,556 sqft
Property
Parking
- Parking features: Driveway/Pad
- Has uncovered spaces: Yes
Features
- Stories: 1.5
- Patio & porch: Porch, Patio
- Pool features: None
Lot
- Size: 5,662 Square Feet
- Dimensions: 45 x 127
- Features: Some Trees
Details
- Parcel number: 022034 00051
Construction
Type & style
- Home type: SingleFamily
- Architectural style: Traditional
- Property subtype: Single Family Residence
Materials
- Vinyl Siding
Condition
- New construction: No
- Year built: 1910
Community & HOA
Community
- Subdivision: Rawlings
Location
- Region: Memphis
Financial & listing details
- Price per square foot: $71/sqft
- Tax assessed value: $123,200
- Annual tax amount: $1,624
- Price range: $109.9K - $109.9K
- Date on market: 9/10/2026
Estimated market value
$106,700
$101,000 - $112,000
$1,130/mo
Price history
| Date | Event | Price |
|---|---|---|
| 9/10/2026 | Listed for sale | $109,900-15.4%$71/sqft |
Source:  MAAR #10230186 Report a problem | ||
| 8/18/2026 | Listing removed | $1,025$1/sqft |
Source: Zillow Rentals Report a problem | ||
| 8/11/2026 | Listed for rent | $1,025$1/sqft |
Source: Zillow Rentals Report a problem | ||
| 8/10/2026 | Listing removed | $1,025$1/sqft |
Source: Zillow Rentals Report a problem | ||
| 8/5/2026 | Listing removed | $129,900$83/sqft |
Source: MAAR #10210732 Report a problem | ||
| 7/24/2026 | Listed for rent | $1,025$1/sqft |
Source: Zillow Rentals Report a problem | ||
| 4/29/2026 | Price change | $129,900-5.5%$83/sqft |
Source: MAAR #10210732 Report a problem | ||
| 3/2/2026 | Price change | $137,500-3.5%$88/sqft |
Source: MAAR #10210732 Report a problem | ||
| 12/22/2025 | Listed for sale | $142,500$92/sqft |
Source: MAAR #10210732 Report a problem | ||
| 12/17/2025 | Pending sale | $142,500$92/sqft |
Source: MAAR #10210732 Report a problem | ||
| 12/3/2025 | Listed for sale | $142,500+14.9%$92/sqft |
Source: MAAR #10210732 Report a problem | ||
| 12/3/2025 | Listing removed | $1,025$1/sqft |
Source: Zillow Rentals Report a problem | ||
| 10/21/2025 | Listed for rent | $1,025-18%$1/sqft |
Source: Zillow Rentals Report a problem | ||
| 3/26/2025 | Listing removed | $1,250$1/sqft |
Source: Zillow Rentals Report a problem | ||
| 2/25/2025 | Listed for rent | $1,250+4.6%$1/sqft |
Source: Zillow Rentals Report a problem | ||
| 3/18/2024 | Sold | $124,000-8.1%$80/sqft |
Source: Public Record Report a problem | ||
| 12/12/2023 | Listing removed | -- |
Source: Zillow Rentals Report a problem | ||
| 12/1/2023 | Listing removed | -- |
Source: MAAR #10151760 Report a problem | ||
| 12/1/2023 | Price change | $1,195-11.5%$1/sqft |
Source: Zillow Rentals Report a problem | ||
| 11/1/2023 | Listed for rent | $1,350$1/sqft |
Source: Zillow Rentals Report a problem | ||
| 9/27/2023 | Price change | $134,900-3.6%$87/sqft |
Source: MAAR #10151760 Report a problem | ||
| 7/19/2023 | Price change | $139,900-3.5%$90/sqft |
Source: MAAR #10151760 Report a problem | ||
| 7/7/2023 | Listed for sale | $144,900+705%$93/sqft |
Source: MAAR #10151760 Report a problem | ||
| 6/14/2023 | Listing removed | -- |
Source: MAAR #10139652 Report a problem | ||
| 12/23/2019 | Sold | $18,000+45.4%$12/sqft |
Source: MAAR #10067489 Report a problem | ||
| 11/14/2018 | Sold | $12,381+56.7%$8/sqft |
Source: Public Record Report a problem | ||
| 12/8/2017 | Sold | $7,900-74%$5/sqft |
Source: MAAR #10015649 Report a problem | ||
| 4/20/2015 | Sold | $30,421-37.3%$20/sqft |
Source: Public Record Report a problem | ||
| 9/10/1999 | Sold | $48,500$31/sqft |
Source: Public Record Report a problem | ||
Public tax history
| Year | Property taxes | Tax assessment |
|---|---|---|
| 2025 | $1,623 +272.1% | $30,800 +364.9% |
| 2024 | $436 +8.1% | $6,625 |
| 2023 | $404 | $6,625 |
| 2022 | -- | $6,625 |
| 2021 | -- | $6,625 +28% |
| 2020 | $165 | $5,175 |
| 2019 | $165 -21.1% | $5,175 |
| 2018 | $210 -45.1% | $5,175 |
| 2017 | $382 +110% | $5,175 -3.3% |
| 2016 | $182 -12.9% | $5,350 |
| 2014 | $209 | $5,350 |
| 2013 | -- | $5,350 -18.3% |
| 2012 | -- | $6,550 |
| 2011 | -- | $6,550 |
| 2010 | -- | $6,550 |
| 2009 | -- | $6,550 -41.8% |
| 2008 | -- | $11,250 |
| 2007 | -- | $11,250 |
| 2006 | -- | $11,250 |
| 2005 | -- | $11,250 |
| 2004 | -- | $11,250 |
| 2003 | -- | $11,250 |
| 2002 | -- | $11,250 |
| 2001 | -- | $11,250 +42.4% |
| 2000 | -- | $7,900 |
Find assessor info on the county website
Monthly payment
Est. payment
Payment breakdown
Explore the cost of this home by adjusting the details. Changes won't be saved.Climate risks
Neighborhood: Downtown


Similar homes
- $103,1003 bd1 ba1.1k sqft1137 Kney St, Memphis, TN 38107For Sale
 MLS ID #10219031, Christine S Abston, REMAX Experts. MAAR
- $107,0004 bd2 ba1.3k sqft1339 N McNeil St, Memphis, TN 38108For Sale
 MLS ID #10226481, Pat Edwards-Sipp, BenchMark REALTORS, LLC. MAAR
- $110,0004 bd1 ba1.1k sqft3253 Markley St, Memphis, TN 38127For Sale
 MLS ID #10232883, Tyler Tapley, Crye-Leike, Inc., REALTORS. MAAR
- $134,9004 bd3 ba2.1k sqft961 N Dunlap St, Memphis, TN 38107For Sale
 MLS ID #10228758, Tyler Bowman, Weichert, REALTORS-BenchMark. MAAR
