$--
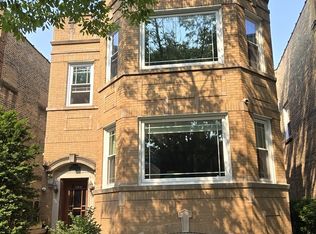
3 bd|1 ba|1.2k sqft
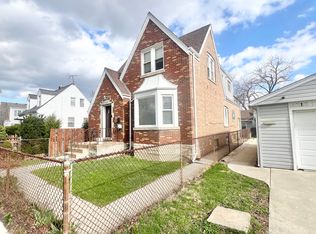
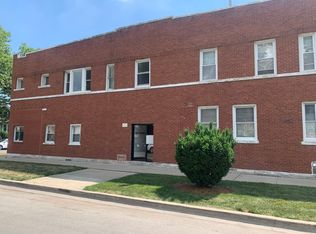
4524 W Lawrence Ave #2, Chicago, IL 60630
Off Market

Zillow last checked:
Arceli Antonio 847-293-5111,
RE/MAX City
$683,700
$650,000 - $718,000
$2,050/mo
| Date | Event | Price |
|---|---|---|
| 5/22/2026 | Listing removed | $689,900 |
Source: REMAX Report a problem | ||
| 5/20/2026 | Listed for sale | $689,900-1.4% |
Source: REMAX Report a problem | ||
| 4/30/2026 | Listing removed | $699,900 |
Source: | ||
| 1/14/2026 | Price change | $699,900-6.7% |
Source: | ||
| 11/27/2025 | Listed for sale | $749,800+25.2% |
Source: | ||
| 11/3/2023 | Listing removed | -- |
Source: | ||
| 5/2/2023 | Listed for sale | $599,000 |
Source: | ||
| 4/22/2023 | Contingent | $599,000 |
Source: | ||
| 6/17/2022 | Listed for sale | $599,000-0.2% |
Source: | ||
| 6/8/2022 | Listing removed | -- |
Source: | ||
| 4/29/2022 | Price change | $599,999-4.7% |
Source: | ||
| 3/15/2022 | Listed for sale | $629,900+5% |
Source: | ||
| 12/13/2021 | Listing removed | -- |
Source: | ||
| 7/7/2021 | Listed for sale | $599,900+3.4% |
Source: | ||
| 11/17/2018 | Listing removed | $579,900 |
Source: RE/MAX Masters #10032653 Report a problem | ||
| 7/27/2018 | Price change | $579,900+0.2% |
Source: RE/MAX Masters #10032653 Report a problem | ||
| 4/5/2018 | Price change | $579,000-2.7% |
Source: RE/MAX Masters #09675664 Report a problem | ||
| 7/30/2017 | Price change | $594,900-5% |
Source: RE/MAX Masters #09675664 Report a problem | ||
| 6/29/2017 | Listed for sale | $625,900+163% |
Source: RE/MAX Masters #09675664 Report a problem | ||
| 9/23/2011 | Sold | $238,000 |
Source: | ||
| Year | Property taxes | Tax assessment |
|---|---|---|
| 2024 | -- | $56,115 +32.3% |
| 2023 | $9,596 +2.6% | $42,403 |
| 2022 | $9,349 +2.4% | $42,403 |
| 2021 | $9,129 +11.8% | $42,403 +16.1% |
| 2020 | $8,166 -3.5% | $36,529 -13% |
| 2019 | $8,464 +1.7% | $41,988 |
| 2018 | $8,321 +24.5% | $41,988 +35.7% |
| 2017 | $6,683 +7.5% | $30,944 |
| 2016 | $6,219 -0.4% | $30,944 -8.9% |
| 2015 | $6,246 +40.9% | $33,967 +42.7% |
| 2014 | $4,432 +2% | $23,800 |
| 2013 | $4,344 -18.7% | $23,800 -20.1% |
| 2012 | $5,343 +8.2% | $29,777 -10.1% |
| 2011 | $4,940 -7.9% | $33,136 -12.4% |
| 2010 | $5,364 +7.9% | $37,811 |
| 2009 | $4,971 -13.2% | $37,811 -18.9% |
| 2008 | $5,725 +7.5% | $46,626 |
| 2007 | $5,324 +16.4% | $46,626 |
| 2006 | $4,573 -10.2% | $46,626 +49.6% |
| 2005 | $5,094 +1% | $31,174 |
| 2004 | $5,043 +2.2% | $31,174 |
| 2003 | $4,933 +26.1% | $31,174 +43.2% |
| 2002 | $3,912 +3.7% | $21,775 |
| 2001 | $3,771 -1.1% | $21,775 |
| 2000 | $3,814 -0.7% | $21,775 +9.7% |
| 1999 | $3,840 | $19,854 |
Source: MRED as distributed by MLS GRID. This data may not be complete. We recommend contacting the local school district to confirm school assignments for this home.
A local agent can set up tours, give advice and negotiate with sellers.
A local lender can help you make sure your offer is ready when you are.