$457,100
3 bd|2 ba|1.6k sqft
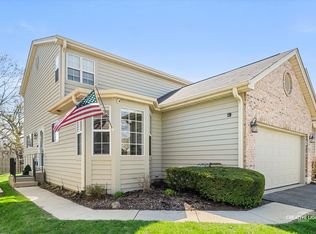
1140 Greensfield Dr, Naperville, IL 60563
Off Market

Zillow last checked:
Daniel Firks 630-674-6547,
Coldwell Banker Real Estate Group
Not available
Estimated sales range
Not available
Not available
| Date | Event | Price |
|---|---|---|
| 4/3/2017 | Sold | $270,000-3.6%$143/sqft |
Source: | ||
| 1/31/2017 | Pending sale | $280,000$148/sqft |
Source: RE/MAX of Naperville #09486180 Report a problem | ||
| 1/26/2017 | Listed for sale | $280,000+5.7%$148/sqft |
Source: RE/MAX of Naperville #09486180 Report a problem | ||
| 5/31/2016 | Sold | $264,950-1.8%$140/sqft |
Source: | ||
| 4/4/2016 | Pending sale | $269,900$143/sqft |
Source: RE/MAX of Naperville #09149809 Report a problem | ||
| 4/1/2016 | Price change | $269,900-3.6%$143/sqft |
Source: RE/MAX of Naperville #09149809 Report a problem | ||
| 3/18/2016 | Listed for sale | $279,900$148/sqft |
Source: RE/MAX of Naperville #09149809 Report a problem | ||
| 3/16/2016 | Pending sale | $279,900$148/sqft |
Source: RE/MAX of Naperville #09149809 Report a problem | ||
| 2/29/2016 | Listed for sale | $279,900+19.9%$148/sqft |
Source: RE/MAX of Naperville #09149809 Report a problem | ||
| 12/14/2010 | Sold | $233,500-1.1%$124/sqft |
Source: Public Record Report a problem | ||
| 11/8/2010 | Pending sale | $236,000$125/sqft |
Source: Naperville Professionals Inc #07603100 Report a problem | ||
| 8/10/2010 | Listed for sale | $236,000+12.1%$125/sqft |
Source: Naperville Professionals Inc #07603100 Report a problem | ||
| 3/10/2010 | Sold | $210,500-20.5%$112/sqft |
Source: Public Record Report a problem | ||
| 10/8/2009 | Listing removed | $264,900$140/sqft |
Source: EpropertySites #06976283 Report a problem | ||
| 7/29/2008 | Listed for sale | $264,900+4.9%$140/sqft |
Source: Re/Max Professionals Select #06976283 Report a problem | ||
| 7/19/2005 | Sold | $252,500+68.3%$134/sqft |
Source: Public Record Report a problem | ||
| 8/26/1998 | Sold | $150,000$80/sqft |
Source: Public Record Report a problem | ||
| Year | Property taxes | Tax assessment |
|---|---|---|
| 2024 | $6,498 +4.1% | $114,063 +9.6% |
| 2023 | $6,244 +6.3% | $104,100 +7.6% |
| 2022 | $5,875 +3.9% | $96,770 +3.9% |
| 2021 | $5,654 +2.2% | $93,110 +1.8% |
| 2020 | $5,531 +3.1% | $91,440 +4.5% |
| 2019 | $5,364 +4.3% | $87,490 +4% |
| 2018 | $5,144 +2.2% | $84,130 +3.5% |
| 2017 | $5,035 +2.2% | $81,290 +3.8% |
| 2016 | $4,928 +0.9% | $78,350 +6.2% |
| 2015 | $4,886 +0.8% | $73,780 +3.7% |
| 2014 | $4,847 +1.5% | $71,120 -0.2% |
| 2013 | $4,775 +3.1% | $71,290 -3.8% |
| 2012 | $4,632 +1.3% | $74,070 -6% |
| 2011 | $4,572 -0.6% | $78,760 -6.2% |
| 2010 | $4,598 +1.1% | $83,990 -5% |
| 2009 | $4,550 +2.6% | $88,400 +1.4% |
| 2008 | $4,437 +4.7% | $87,180 +5.9% |
| 2007 | $4,236 +5.6% | $82,330 +8% |
| 2006 | $4,011 +3.8% | $76,240 +6.7% |
| 2005 | $3,864 +2.6% | $71,450 +5.9% |
| 2004 | $3,765 +4.9% | $67,470 +8.4% |
| 2003 | $3,590 +8.1% | $62,240 +8.5% |
| 2002 | $3,321 +7.6% | $57,360 +7.5% |
| 2001 | $3,085 +13.8% | $53,360 +5.9% |
| 2000 | $2,711 | $50,390 |
Source: MRED as distributed by MLS GRID. This data may not be complete. We recommend contacting the local school district to confirm school assignments for this home.
A local agent can set up tours, give advice and negotiate with sellers.