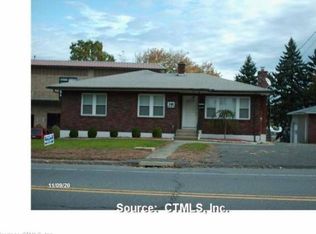
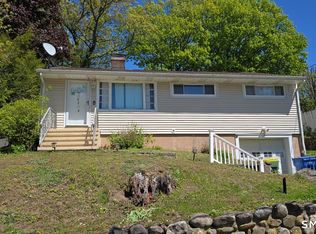
Spacious Cape Cod in a convenient East End location. This home features 3 bedrooms, 1.5 baths, and 1,470 sq ft of living space with a bright open main level. Hardwood floors, updated stairs, and a newer roof add great value. Full basement and 1-car garage. Large open backyard with room to relax or entertain. Connected to public water, sewer, and natural gas. A solid home with great potential - ideal for homeowners or investors looking to build equity.
For sale
Price cut: $21K (5/19)
$299,000
Waterbury, CT 06705
3beds
1,470sqft
Single Family Residence
Built in 1936
5,662 Square Feet Lot
$-- Zestimate®
$203/sqft
$-- HOA
What's special
- 157 days |
- 316 |
- 13 |
Zillow last checked:
Listing updated:
Listed by:
Nathaniel Correa (203)247-8512,
Smart Realty Services Corp 203-437-7919
Source: Smart MLS,MLS#: 24149301
Loading...
Facts & features
Interior
Bedrooms & bathrooms
- Bedrooms: 3
- Bathrooms: 2
- Full bathrooms: 1
- 1/2 bathrooms: 1
Primary bedroom
- Level: Main
Bedroom
- Level: Upper
Bedroom
- Level: Upper
Bathroom
- Level: Upper
Bathroom
- Level: Main
Living room
- Level: Main
Heating
- Hot Water, Natural Gas
Cooling
- None
Appliances
- Included: Oven/Range, Refrigerator, Washer, Dryer, Water Heater
Features
- Basement: Partial,Garage Access
- Attic: None
- Has fireplace: No
Interior area
- Total structure area: 1,470
- Total interior livable area: 1,470 sqft
- Finished area above ground: 1,470
Property
Lot
- Size: 5,662 Square Feet
- Features: Level
Details
- Parcel number: 1378872
- Zoning: RL
Construction
Type & style
- Home type: SingleFamily
- Architectural style: Cape Cod
- Property subtype: Single Family Residence
Materials
- Vinyl Siding
- Foundation: Concrete Perimeter
- Roof: Asphalt
Condition
- New construction: No
- Year built: 1936
Utilities & green energy
- Sewer: Public Sewer
- Water: Public
Community & HOA
HOA
- Has HOA: No
Location
- Region: Waterbury
Financial & listing details
- Price per square foot: $203/sqft
- Tax assessed value: $121,170
- Annual tax amount: $4,885
- Date on market: 1/16/2026
Estimated market value
Not available
Estimated sales range
Not available
Not available
Price history
| Date | Event | Price |
|---|---|---|
| 5/19/2026 | Price change | $299,000-6.6%$203/sqft |
Source: | ||
| 5/14/2026 | Listed for sale | $320,000$218/sqft |
Source: | ||
| 5/4/2026 | Pending sale | $320,000$218/sqft |
Source: | ||
| 3/2/2026 | Price change | $320,000-3%$218/sqft |
Source: | ||
| 1/16/2026 | Listed for sale | $330,000+57.1%$224/sqft |
Source: | ||
| 5/22/2023 | Sold | $210,000-4.5%$143/sqft |
Source: | ||
| 5/22/2023 | Contingent | $219,900$150/sqft |
Source: | ||
| 12/30/2022 | Listed for sale | $219,900+164.9%$150/sqft |
Source: | ||
| 6/4/2020 | Sold | $83,000+38.3%$56/sqft |
Source: | ||
| 4/15/2020 | Listed for sale | $60,000-47%$41/sqft |
Source: Equinox Properties #170288358 Report a problem | ||
| 11/28/2019 | Listing removed | -- |
Source: Hudson & Marshall Report a problem | ||
| 11/5/2019 | Listed for sale | -- |
Source: Hudson & Marshall Report a problem | ||
| 3/1/2010 | Sold | $113,300+92%$77/sqft |
Source: | ||
| 9/23/2009 | Sold | $59,000-10.1%$40/sqft |
Source: Public Record Report a problem | ||
| 6/23/2009 | Listing removed | $65,610$45/sqft |
Source: foreclosure.com Report a problem | ||
| 5/3/2009 | Price change | $65,610-10%$45/sqft |
Source: foreclosure.com Report a problem | ||
| 4/1/2009 | Price change | $72,900-10%$50/sqft |
Source: foreclosure.com Report a problem | ||
| 3/2/2009 | Price change | $81,000-10%$55/sqft |
Source: foreclosure.com Report a problem | ||
| 2/2/2009 | Price change | $90,000-10%$61/sqft |
Source: foreclosure.com Report a problem | ||
| 1/11/2009 | Listed for sale | $100,000-16.7%$68/sqft |
Source: foreclosure.com Report a problem | ||
| 4/16/2008 | Sold | $120,000+66.7%$82/sqft |
Source: Public Record Report a problem | ||
| 5/31/2000 | Sold | $72,000$49/sqft |
Source: Public Record Report a problem | ||
Public tax history
| Year | Property taxes | Tax assessment |
|---|---|---|
| 2025 | $5,450 -9% | $121,170 |
| 2024 | $5,991 -8.8% | $121,170 |
| 2023 | $6,566 +53.6% | $121,170 +70.7% |
| 2022 | $4,274 | $70,980 |
| 2021 | $4,274 +0% | $70,980 +2.5% |
| 2020 | $4,274 +2.5% | $69,270 |
| 2019 | $4,171 | $69,270 |
| 2018 | $4,171 -12.1% | $69,270 -12.1% |
| 2017 | $4,744 | $78,790 |
| 2016 | $4,744 +3.4% | $78,790 |
| 2015 | $4,587 | $78,790 |
| 2014 | $4,587 +2.2% | $78,790 |
| 2013 | $4,489 +2% | $78,790 -25.1% |
| 2012 | $4,399 0% | $105,220 |
| 2011 | $4,400 -0.3% | $105,220 -0.3% |
| 2010 | $4,412 +6.3% | $105,490 +1.4% |
| 2009 | $4,152 -0.2% | $104,010 -0.2% |
| 2008 | $4,162 +9.2% | $104,270 +47.6% |
| 2005 | $3,812 +6.1% | $70,630 +7.8% |
| 2002 | $3,594 +132.3% | $65,520 +314.2% |
| 2001 | $1,547 | $15,820 |
Monthly payment
Est. payment$--/mo
Payment breakdown
Explore the cost of this home by adjusting the details. Changes won't be saved.All calculations are estimates and provided by Zillow, Inc. for informational purposes only. Actual amounts may vary.
HOA fees may include property taxes on listings classified as Co-Ops. Contact the listing agent and/or owner for fee details.
Mortgage interest rates are dependent on a number of factors, including credit score, down payment, and repayment length. Interest rate data provided by Zillow Group Marketplace, Inc. as of 1/1/1970 from various mortgage lenders with which we have lead or other similar arrangements; the Estimated Payment is an average of those rates.
See how much you could borrow to make a competitive offer.
Climate risks
Neighborhood: Mill Plain
Nearby schools
GreatSchools rating
- 5/10H. S. Chase SchoolGrades: PK-5Distance: 0.7 mi
- 4/10Michael F. Wallace Middle SchoolGrades: 4-8Distance: 2.2 mi
- 1/10Crosby High SchoolGrades: 9-12Distance: 2.2 mi
A local agent can set up tours, give advice and negotiate with sellers.


Nearby cities
Nearby neighborhoods
Nearby zip codes
Other Waterbury Topics
