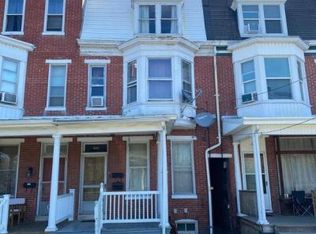
Looking to add a strong income-producing property to your portfolio? 1023 S Queen Street offers 3 rental units generating over $36,000 per year in rental income, providing an excellent opportunity for investors looking for immediate cash flow and long-term growth.
For sale
$345,000
1023 S Queen St, York, PA 17403
3beds
--baths
2,250sqft
Townhouse
Built in 1900
-- sqft lot
$337,500 Zestimate®
$153/sqft
$-- HOA
What's special
- 65 days
- 99
- 2
Zillow last checked:
Listing updated:
Listed by:
John MacDonald 717-495-2443,
Core Partners Realty LLC 7177180748
Source: Bright MLS,MLS#: PAYK2110396
Facts & features
Interior
Bedrooms & bathrooms
- Bedrooms: 3
Basement
- Area: 0
Heating
- Radiator, Natural Gas
Cooling
- None
Appliances
- Included: Gas Water Heater
Features
- Has basement: No
- Has fireplace: No
Interior area
- Total structure area: 2,250
- Total interior livable area: 2,250 sqft
Property
Parking
- Total spaces: 1
- Parking features: Oversized, Detached
- Garage spaces: 1
Accessibility
- Accessibility features: None
Features
- Pool features: None
Lot
- Size: 2,296 Square Feet
Details
- Additional structures: Above Grade, Below Grade
- Parcel number: 155960300110000000
- Zoning: UN2
- Zoning description: Urban Residential Neighborhood District
- Special conditions: Standard
Construction
Type & style
- Home type: MultiFamily
- Architectural style: Traditional
- Property subtype: Townhouse
Materials
- Brick
- Foundation: Permanent
Condition
- Very Good
- New construction: No
- Year built: 1900
Utilities & green energy
- Sewer: Public Sewer
- Water: Public
Community & HOA
Community
- Subdivision: York City
Location
- Region: York
- Municipality: YORK CITY
Financial & listing details
- Price per square foot: $153/sqft
- Tax assessed value: $80,390
- Annual tax amount: $5,161
- Date on market: 8/21/2026
- Listing agreement: Exclusive Agency
- Listing terms: Conventional,Cash
- Exclusions: Tenant Property
- Ownership: Fee Simple
- Total actual rent: 36000
Estimated market value
$337,500
$321,000 - $354,000
$1,216/mo
Price history
| Date | Event | Price |
|---|---|---|
| 8/21/2026 | Listed for sale | $345,000+97.1%$153/sqft |
Source:  Bright MLS #PAYK2110396 Report a problem | ||
| 5/10/2024 | Sold | $175,000$78/sqft |
Source: Bright MLS #PAYK2059168 Report a problem | ||
| 4/27/2024 | Pending sale | $175,000$78/sqft |
Source: Bright MLS #PAYK2059168 Report a problem | ||
| 4/20/2024 | Listed for sale | $175,000+1650%$78/sqft |
Source: Bright MLS #PAYK2059168 Report a problem | ||
| 1/20/2015 | Sold | $10,000-77.5%$4/sqft |
Source: Public Record Report a problem | ||
| 10/25/2001 | Sold | $44,500+3451.5%$20/sqft |
Source: Public Record Report a problem | ||
| 2/24/2000 | Sold | $1,253$1/sqft |
Source: Public Record Report a problem | ||
Public tax history
| Year | Property taxes | Tax assessment |
|---|---|---|
| 2026 | $5,109 -4.2% | $80,390 |
| 2025 | $5,333 +13.9% | $80,390 +7.5% |
| 2024 | $4,681 | $74,750 |
| 2023 | $4,681 +4.3% | $74,750 |
| 2022 | $4,487 -1.2% | $74,750 |
| 2021 | $4,539 +3.6% | $74,750 |
| 2020 | $4,381 +0.2% | $74,750 |
| 2019 | $4,373 | $74,750 |
| 2018 | $4,373 -0.9% | $74,750 |
| 2017 | $4,414 | $74,750 |
| 2016 | -- | $74,750 |
| 2015 | $3,863 | $74,750 |
| 2014 | $3,863 | $74,750 |
| 2013 | -- | $74,750 |
| 2012 | -- | $74,750 |
| 2011 | -- | $74,750 |
| 2010 | -- | $74,750 |
| 2009 | -- | $74,750 |
| 2008 | -- | $74,750 |
| 2007 | -- | $74,750 |
| 2006 | -- | $74,750 +28.2% |
| 2005 | -- | $58,300 -4.3% |
| 2004 | -- | $60,890 |
| 2003 | -- | $60,890 +4.4% |
| 2002 | -- | $58,300 |
| 2000 | -- | $58,300 |
| 1999 | -- | $58,300 |
Find assessor info on the county website
Monthly payment
Est. payment
Payment breakdown
Explore the cost of this home by adjusting the details. Changes won't be saved.Climate risks
Neighborhood: Veterans Memorial Park
Similar homes
- $349,9003 bd2 ba1.8k sqft1733 Powder Mill Rd, York, PA 17403For Sale
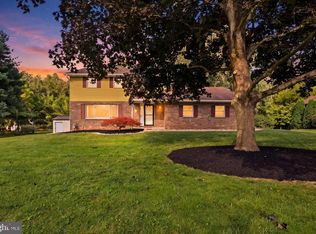
 MLS ID #PAYK2110288, Jill Romine, Keller Williams Keystone Realty. Bright MLS
- $289,9003 bd2 ba1.7k sqft1910 S Queen St, York, PA 17403For Sale
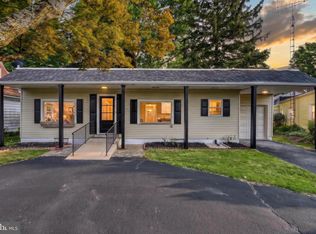 MLS ID #PAYK2113746, Randell Jackson, Keller Williams Keystone Realty. Bright MLS
- $325,0004 bd3 ba2.4k sqft256 Tri Hill Rd, York, PA 17403For Sale
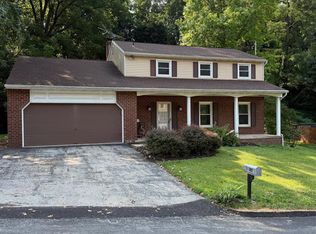 MLS ID #PAYK2109260, Brian Blanchette, Berkshire Hathaway HomeServices Homesale Realty. Bright MLS
- $325,0003 bd2 ba2.1k sqft516 S Yale St, York, PA 17403For Sale
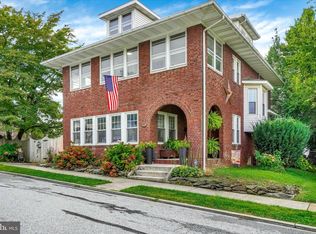 MLS ID #PAYK2111918, Michael Wheeler, Berkshire Hathaway HomeServices Homesale Realty. Bright MLS
- $299,0004 bd4 ba1.8k sqft172 Springdale Rd, York, PA 17403For SaleMLS ID #PAYK2113262, Crystal Frear, Iron Valley Real Estate of York County. Bright MLS
- $275,0003 bd1 ba2k sqft353 Edgehill Rd, York, PA 17403For SaleMLS ID #PAYK2114104, Curt Perago, Curtis Richard Perago. Bright MLS
- $299,9003 bd3 ba2.5k sqft362 Greendale Rd, York, PA 17403For SaleMLS ID #PAYK2113144, FRAN VALERIO, Coldwell Banker Realty. Bright MLS
- $309,9003 bd3 ba1.8k sqft2032 Wyntre Brooke Dr S, York, PA 17403For SaleMLS ID #PAYK2113540, Tally Fisher, Howard Hanna Real Estate Services-York. Bright MLS
- $349,9004 bd2 ba2.9k sqft980 Brockie Ln, York, PA 17403For SaleMLS ID #PAYK2112634, Katie Klenk, Keller Williams Legacy. Bright MLS
- $299,9004 bd2 ba2.3k sqft958 Country Club Rd, York, PA 17403For SaleMLS ID #PAYK2113844, Cheryl Yerger, The Exchange Real Estate Company LLC. Bright MLS
- $295,0004 bd2 ba2.4k sqft828 S Queen St, York, PA 17403For SaleMLS ID #PAYK2112836, Colin Cameron, EXP Realty, LLC. Bright MLS
- $310,0004 bd2 ba2.8k sqft155 E Springettsbury Ave, York, PA 17403For SaleMLS ID #PAYK2101156, Nathan Krotzer, RE/MAX Pinnacle. Bright MLS
- $325,9003 bd2 ba2k sqft1215 Perry Ln, York, PA 17403For SaleMLS ID #PAYK2103598, Maria Accardo, Keller Williams Keystone Realty. Bright MLS
- $399,9002 bd2 ba2.4k sqft1319 Hillcroft Ln, York, PA 17403For SaleMLS ID #PAYK2111980, Reid Weinbrom, Keller Williams Keystone Realty. Bright MLS
- $--3 bd2 ba1.7k sqft840 Kelly Dr, York, PA 17404For SaleMLS ID #PAYK2114054, Matthew Torres, Coldwell Banker Realty. Bright MLS
- $260,0003 bd2 ba1.3k sqft887 Clearmount Rd, York, PA 17403For SaleMLS ID #PAYK2113826, Donna Troupe, Berkshire Hathaway HomeServices Homesale Realty. Bright MLS
- $349,0005 bd2 ba2.1k sqft1409 1st Ave, York, PA 17403For SaleMLS ID #PAYK2111610, Philip Accardo, Keller Williams Keystone Realty. Bright MLS
- $299,9006 bd-- ba2.5k sqft873 E Prospect St, York, PA 17403For SaleMLS ID #PAYK2103524, Spencer Blake, Renaissance Realty Sales, LLC. Bright MLS
- $295,0003 bd3 ba1.8k sqft1672 Wyntre Brooke Dr #5G, York, PA 17403For SaleMLS ID #PAYK2113914, Jenni Goodling, Coldwell Banker Realty. Bright MLS
- $379,9004 bd3 ba2k sqft1841 Radnor Rd, York, PA 17402For SaleMLS ID #PAYK2112036, Jim Powers, Berkshire Hathaway HomeServices Homesale Realty. Bright MLS
