Sweet In-Town Farmhouse! Great location, Wonderful opportunity to live within walking distance to all schools and the center of town. First floor bedroom with private full bath,, eat-in kitchen with walk-in pantry, formal dining room and living room with beautiful hardwood floors. Second floor offers full bathroom and two additional bedrooms plus a bonus room that could be a nursery/office/den. Front porch and side deck overlooking large flat parcel. Many updates include oil to natural gas heating conversion, boiler with on demand hot water, newer architectural roof on main house, newer vinyl siding. A sweet home to call your own!
For sale
$375,000
104 Orchard St, Lee, MA 01238
3beds
1,500sqft
Single Family Residence
Built in 1880
0.29 Acres Lot
$365,300 Zestimate®
$250/sqft
$-- HOA
What's special
Front porchNewer vinyl sidingFormal dining room
- 6 days
- 686
- 23
Likely to sell faster than
Zillow last checked:
Listing updated:
Listed by:
Lisa Kelley 413-243-4647,
MACCARO REAL ESTATE
Source: BCMLS,MLS#: 251371
Facts & features
Interior
Bedrooms & bathrooms
- Bedrooms: 3
- Bathrooms: 2
- Full bathrooms: 2
Heating
- Nat Gas, Boiler
Appliances
- Included: Dryer, Range, Refrigerator, Washer
Features
- Flooring: Carpet, Ceramic Tile, Laminate, Wood
- Basement: Unfinished,Sump Pump,Interior Entry,Full,Crawl Space,Concrete
Interior area
- Total structure area: 1,500
- Total interior livable area: 1,500 sqft
Property
Parking
- Parking features: Private
- Details: Private
Accessibility
- Accessibility features: Accessible Bedroom, 1st Flr Bdrm w/Bath
Features
- Patio & porch: Porch, Deck
- Exterior features: Lighting, Bus-School
Lot
- Size: 0.29 Acres
Details
- Parcel number: LEEE M:019 B:0A L:00000034.0
- Zoning description: Residential
Construction
Type & style
- Home type: SingleFamily
- Architectural style: NE Farmhouse
- Property subtype: Single Family Residence
Materials
- Roof: Asphalt Shingles
Condition
- Year built: 1880
Utilities & green energy
- Electric: 200 Amp
- Sewer: Public Sewer
- Water: Public
Community & HOA
Location
- Region: Lee
Financial & listing details
- Price per square foot: $250/sqft
- Tax assessed value: $248,700
- Annual tax amount: $2,902
- Date on market: 11/14/2026
Estimated market value
$365,300
$347,000 - $384,000
$2,473/mo
Price history
| Date | Event | Price |
|---|---|---|
| 11/19/2026 | Listing removed | $2,300$2/sqft |
Source: Zillow Rentals Report a problem | ||
| 11/14/2026 | Listed for sale | $375,000+207.4%$250/sqft |
Source:  BCMLS #251371 Report a problem | ||
| 10/31/2026 | Listed for rent | $2,300-7.1%$2/sqft |
Source: Zillow Rentals Report a problem | ||
| 10/6/2026 | Listing removed | $2,475$2/sqft |
Source: Zillow Rentals Report a problem | ||
| 9/3/2026 | Price change | $2,475-4.8%$2/sqft |
Source: Zillow Rentals Report a problem | ||
| 8/7/2026 | Listed for rent | $2,600+4%$2/sqft |
Source: Zillow Rentals Report a problem | ||
| 7/31/2026 | Listing removed | $2,500$2/sqft |
Source: Zillow Rentals Report a problem | ||
| 7/28/2026 | Listed for rent | $2,500+19%$2/sqft |
Source: Zillow Rentals Report a problem | ||
| 8/17/2023 | Listing removed | -- |
Source: Zillow Rentals Report a problem | ||
| 8/9/2023 | Listed for rent | $2,100$1/sqft |
Source: Zillow Rentals Report a problem | ||
| 8/4/2023 | Listing removed | -- |
Source: Zillow Rentals Report a problem | ||
| 7/19/2023 | Price change | $2,100-4.5%$1/sqft |
Source: Zillow Rentals Report a problem | ||
| 4/24/2023 | Price change | $2,200+10%$1/sqft |
Source: Zillow Rentals Report a problem | ||
| 4/10/2023 | Listed for rent | $2,000$1/sqft |
Source: Zillow Rentals Report a problem | ||
| 4/10/2023 | Listing removed | -- |
Source: Zillow Rentals Report a problem | ||
| 3/27/2023 | Listed for rent | $2,000+11.1%$1/sqft |
Source: Zillow Rentals Report a problem | ||
| 5/13/2022 | Listing removed | -- |
Source: Zillow Rental Manager Report a problem | ||
| 4/30/2022 | Listed for rent | $1,800-10%$1/sqft |
Source: Zillow Rental Manager Report a problem | ||
| 1/4/2022 | Listing removed | -- |
Source: Zillow Rental Manager Report a problem | ||
| 12/11/2021 | Price change | $2,000-9.1%$1/sqft |
Source: Zillow Rental Manager Report a problem | ||
| 11/11/2021 | Listed for rent | $2,200+33.3%$1/sqft |
Source: Zillow Rental Manager Report a problem | ||
| 1/7/2021 | Listing removed | -- |
Source: Zillow Rental Manager Report a problem | ||
| 1/2/2021 | Listed for rent | $1,650$1/sqft |
Source: Zillow Rental Manager Report a problem | ||
| 4/26/2018 | Sold | $122,000-12.8%$81/sqft |
Source: BCMLS #221818 Report a problem | ||
| 2/9/2018 | Pending sale | $139,900$93/sqft |
Source: Berkshire Real Estate #221818 Report a problem | ||
Public tax history
| Year | Property taxes | Tax assessment |
|---|---|---|
| 2025 | $2,798 +5.8% | $248,700 +5.7% |
| 2024 | $2,645 +3.6% | $235,300 +9% |
| 2023 | $2,554 +4.8% | $215,900 +20.9% |
| 2022 | $2,438 -2.3% | $178,600 +5.1% |
| 2021 | $2,496 +6.5% | $170,000 +6.5% |
| 2020 | $2,343 +18.2% | $159,600 +19% |
| 2019 | $1,982 +1.4% | $134,100 +0.4% |
| 2018 | $1,955 -1% | $133,600 -0.4% |
| 2017 | $1,975 +2.5% | $134,200 +1.4% |
| 2016 | $1,926 +3.4% | $132,300 |
| 2015 | $1,863 -0.5% | $132,300 |
| 2014 | $1,872 +0.4% | $132,300 |
| 2013 | $1,864 +1.6% | $132,300 -1.4% |
| 2012 | $1,835 -2.1% | $134,200 -6.5% |
| 2011 | $1,874 -2.6% | $143,500 -6% |
| 2010 | $1,924 +3.6% | $152,600 |
| 2009 | $1,857 +3.5% | $152,600 |
| 2008 | $1,795 +17.6% | $152,600 +22.6% |
| 2007 | $1,526 +5.9% | $124,500 +15.7% |
| 2006 | $1,441 +2.9% | $107,600 +8.5% |
| 2005 | $1,401 +3.5% | $99,200 +15.3% |
| 2004 | $1,354 +7.2% | $86,000 +5.5% |
| 2002 | $1,263 +14% | $81,500 +22.4% |
| 2001 | $1,108 +0.2% | $66,600 -8% |
| 1997 | $1,106 | $72,400 |
Find assessor info on the county website
Monthly payment
Est. payment
Payment breakdown
Explore the cost of this home by adjusting the details. Changes won't be saved.Climate risks
Neighborhood: 01238
Nearby schools
Similar homes
- $299,9003 bd1 ba1.4k sqft759 Greylock St, Lee, MA 01238For Sale
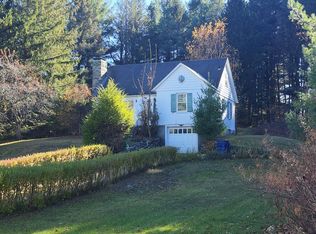 MLS ID #251316, Wendy M Smith, RE/MAX COMPASS. BCMLS
- $425,0003 bd2 ba1.5k sqft23 Eric Dr, Pittsfield, MA 01201For Sale
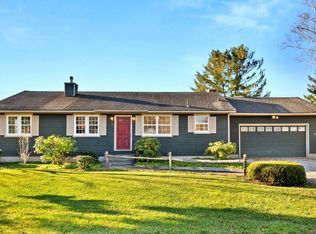 MLS ID #251402, Nick Geranios, WILLIAM PITT SOTHEBY'S - LENOX. BCMLS
- $475,0003 bd3 ba1.7k sqft190 Willow St, Lee, MA 01238For Sale
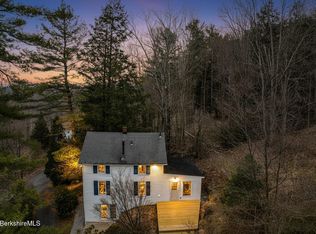 MLS ID #247919, Kim Bergland, RED HORSE REAL ESTATE, LLC. BCMLS
- $349,9003 bd2 ba1.3k sqft17 Maple St, Great Barrington, MA 01230For Sale
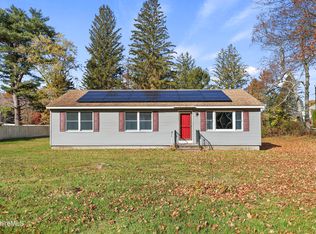 MLS ID #251350, Lisa Kelley, MACCARO REAL ESTATE. BCMLS
