Great Investment Opportunity in Chicago's East Side Neighborhood! Don't miss this unique opportunity to own a two-unit property situated on a double lot in Chicago's East Side neighborhood. Offering excellent potential for investors. Conveniently located near neighborhood amenities, shopping, dining, parks, and transportation, this property is ready for its next owner to bring their vision to life. Explore the possibilities and make this property your next investment!
New
$185,000
10636 S Avenue M, Chicago, IL 60617
6beds
--sqft
Multi Family
Built in 1886
-- sqft lot
$-- Zestimate®
$--/sqft
$-- HOA
What's special
- 5 days
- 367
- 35
Zillow last checked:
Listing updated:
Listed by:
Oscar Estrada (312)785-1757,
eXp Realty
Source: MRED as distributed by MLS GRID,MLS#: 12786432
Facts & features
Interior
Bedrooms & bathrooms
- Bedrooms: 6
- Bathrooms: 2
- Full bathrooms: 2
Heating
- Forced Air
Features
- Basement: None
Property
Lot
- Size: 6,098 Square Feet
- Dimensions: 50 X 125
Details
- Parcel number: 26171010410000
- Zoning: MULTI
- Special conditions: None
Construction
Type & style
- Home type: MultiFamily
- Property subtype: Multi Family
Materials
- Vinyl Siding
Condition
- New construction: No
- Year built: 1886
Utilities & green energy
- Sewer: Public Sewer
- Water: Lake Michigan, Public
Community & HOA
Location
- Region: Chicago
Financial & listing details
- Tax assessed value: $128,010
- Annual tax amount: $2,115
- Date on market: 10/16/2026
- Ownership: Fee Simple
Estimated market value
Not available
Estimated sales range
Not available
Not available
Price history
| Date | Event | Price |
|---|---|---|
| 10/16/2026 | Listed for sale | $185,000+23.3% |
Source: MRED as distributed by MLS GRID #12786432 Report a problem | ||
| 6/30/2025 | Listing removed | $150,000 |
Source: Hubzu #92817304616AUCN5 Report a problem | ||
| 6/19/2025 | Listed for sale | $150,000-9.1% |
Source: Hubzu #92817304616AUCN4 Report a problem | ||
| 6/19/2025 | Listing removed | $165,000 |
Source: Hubzu #92817304616AUCN3 Report a problem | ||
| 6/12/2025 | Listed for sale | $165,000+27% |
Source: Hubzu #92817304616AUCN2 Report a problem | ||
| 3/17/2020 | Listing removed | $129,900 |
Source: Bloom/Sanchez Realty Inc. #10659907 Report a problem | ||
| 3/7/2020 | Listed for sale | $129,900 |
Source: Bloom/Sanchez Realty Inc. #10659907 Report a problem | ||
| 10/16/2019 | Listing removed | $129,900 |
Source: Bloom/Sanchez Realty Inc. #10344634 Report a problem | ||
| 4/15/2019 | Price change | $129,900-3.8% |
Source: Bloom/Sanchez Realty Inc. #10344634 Report a problem | ||
| 2/21/2019 | Price change | $135,000-6.9% |
Source: Bloom/Sanchez Realty Inc. #10165860 Report a problem | ||
| 1/6/2019 | Listed for sale | $145,000-3.3% |
Source: Bloom/Sanchez Realty Inc. #10165860 Report a problem | ||
| 5/12/2018 | Listing removed | $149,900 |
Source: Bloom/Sanchez Realty Inc. #09854564 Report a problem | ||
| 11/10/2017 | Listed for sale | $149,900 |
Source: Bloom/Sanchez Realty Inc. #09798092 Report a problem | ||
Public tax history
| Year | Property taxes | Tax assessment |
|---|---|---|
| 2024 | $2,579 +21.9% | $12,801 +28% |
| 2023 | $2,115 +2.5% | $10,000 |
| 2022 | $2,063 +2.3% | $10,000 |
| 2021 | $2,017 -8.9% | $10,000 +0.8% |
| 2020 | $2,215 -3.6% | $9,917 -13% |
| 2019 | $2,296 +1.7% | $11,399 |
| 2018 | $2,257 -26.3% | $11,399 -19.7% |
| 2017 | $3,063 +7.5% | $14,195 |
| 2016 | $2,850 +9.3% | $14,195 |
| 2015 | $2,608 +26.1% | $14,195 +27.6% |
| 2014 | $2,069 +2% | $11,121 |
| 2013 | $2,027 +1.4% | $11,121 |
| 2012 | $2,000 -9.7% | $11,121 -18.5% |
| 2011 | $2,216 -0.4% | $13,644 |
| 2010 | $2,225 +4.4% | $13,644 |
| 2009 | $2,132 -0.8% | $13,644 -8.7% |
| 2008 | $2,148 +1.1% | $14,946 |
| 2007 | $2,125 -1.1% | $14,946 |
| 2006 | $2,148 +42.7% | $14,946 +62.5% |
| 2005 | $1,505 +1% | $9,196 |
| 2004 | $1,490 +2.2% | $9,196 |
| 2003 | $1,458 -11.7% | $9,196 +0.2% |
| 2002 | $1,652 +3.7% | $9,180 |
| 2001 | $1,593 +5.3% | $9,180 |
| 2000 | $1,512 -0.7% | $9,180 +16.8% |
| 1999 | $1,523 | $7,861 |
Find assessor info on the county website
Monthly payment
Est. payment
Payment breakdown
Explore the cost of this home by adjusting the details. Changes won't be saved.Climate risks
Neighborhood: East Side
Nearby schools

Similar homes
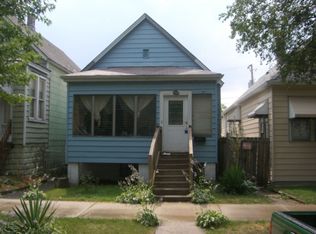
- $150,0003 bd3 ba2.4k sqft8801 S Paxton Ave, Chicago, IL 60617Active
 MLS ID #12783710, Johnnie M Martin, AHWD, JMAR Realty Group. MRED as distributed by MLS GRID
- $179,0004 bd2 ba-- sqft13228 S Houston Ave, Chicago, IL 60633Active
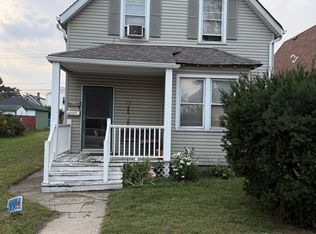 MLS ID #12699318, Elias Quintero, Bloom/Sanchez Realty, Inc.. MRED as distributed by MLS GRID
- $--6 bd2 ba2.1k sqft5919 S La Salle St, Chicago, IL 60621Auction
 Auction.com 1
- $139,9005 bd2 ba-- sqft9231 S Woodlawn Ave, Chicago, IL 60619Active
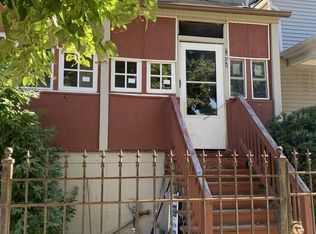 MLS ID #12777361, Bud Steele, Steele Realty Group, Inc.. MRED as distributed by MLS GRID
