1072 Union Street is still available! Due to the large influx of phones calls we would prefer only serious buyers to contact us.
Let someone help pay your mortgage. Original home boasts original HWD floors and woodwork. New insulated windows in orig. home.Newer kitchen , plenty of cabinets. Located on dead end street with 1.5 acres. Detached 2 car garage. Trex deck and trex front porch. Back and side entrance to inlaw. Inlaw features C/A,loft, 2 baths, 24x16 room many possibilities(bdr/media). Home is legal 2 family. Full basement. Original home is approx 2000' GLA, inlaw 1200' GLA. Subject to suitable housing.
For sale by owner
Price cut: $10K (10/1)
$815,000
1072 Union St, Rockland, MA 02370
5beds
3,200sqft
MultiFamily
Built in 1900
-- sqft lot
$-- Zestimate®
$255/sqft
$-- HOA
What's special
Full basementNew insulated windows
- 51 days
- 967
- 41
Listed by:
Property Owner (781) 242-0265
Facts & features
Interior
Bedrooms & bathrooms
- Bedrooms: 5
- Bathrooms: 3
- Full bathrooms: 2
- 1/2 bathrooms: 1
Heating
- Forced air, Oil
Appliances
- Included: Dishwasher, Dryer, Garbage disposal, Microwave, Range / Oven, Refrigerator, Washer
Features
- Flooring: Tile, Hardwood, Linoleum / Vinyl
- Basement: Finished
- Has fireplace: Yes
Interior area
- Total interior livable area: 3,200 sqft
Property
Parking
- Total spaces: 6
- Parking features: Garage - Detached, Off-street
Features
- Exterior features: Other
Lot
- Size: 1 Acres
Details
- Parcel number: ROCKM18B0L7
Construction
Type & style
- Home type: MultiFamily
- Architectural style: Conventional
Materials
- Frame
- Roof: Asphalt
Condition
- New construction: No
- Year built: 1900
Community & HOA
Location
- Region: Rockland
Financial & listing details
- Price per square foot: $255/sqft
- Tax assessed value: $667,200
- Annual tax amount: $9,121
- Date on market: 9/1/2026
Estimated market value
Not available
Estimated sales range
Not available
$2,889/mo
Price history
| Date | Event | Price |
|---|---|---|
| 10/1/2026 | Price change | $815,000-1.2%$255/sqft |
Source: Owner Report a problem | ||
| 9/4/2026 | Price change | $825,000-2.9%$258/sqft |
Source: Owner Report a problem | ||
| 9/1/2026 | Listed for sale | $850,000+46.6%$266/sqft |
Source: Owner Report a problem | ||
| 2/16/2023 | Listing removed | -- |
Source:  Exit Realty Report a problem | ||
| 2/4/2023 | Listed for sale | $579,900+63.6%$181/sqft |
Source: MLS PIN #73076301 Report a problem | ||
| 8/22/2011 | Sold | $354,500-3.9%$111/sqft |
Source: Public Record Report a problem | ||
| 4/11/2011 | Price change | $369,000-2.6%$115/sqft |
Source: Molisse Realty Group #71204779 Report a problem | ||
| 3/25/2011 | Listed for sale | $379,000-5.2%$118/sqft |
Source: Brian Molisse #71204773 Report a problem | ||
| 12/3/2010 | Listing removed | $399,900$125/sqft |
Source: Brian Molisse #71083776 Report a problem | ||
| 10/11/2010 | Price change | $399,900-2.2%$125/sqft |
Source: Brian Molisse #71083776 Report a problem | ||
| 9/18/2010 | Price change | $409,000-6.6%$128/sqft |
Source: Brian Molisse #71083776 Report a problem | ||
| 7/20/2010 | Price change | $438,000-0.4%$137/sqft |
Source: Brian Molisse #71083776 Report a problem | ||
| 5/15/2010 | Listed for sale | $439,900+168.2%$137/sqft |
Source: Brian Molisse #71083776 Report a problem | ||
| 8/14/1989 | Sold | $164,000$51/sqft |
Source: Public Record Report a problem | ||
Public tax history
| Year | Property taxes | Tax assessment |
|---|---|---|
| 2025 | $9,121 +3% | $667,200 +6% |
| 2024 | $8,854 -1.2% | $629,700 +6.9% |
| 2023 | $8,965 +4.3% | $589,000 +14.8% |
| 2022 | $8,594 +9.3% | $513,100 +12.8% |
| 2021 | $7,862 +3.5% | $455,000 +4.9% |
| 2020 | $7,593 +6.4% | $433,900 +8.9% |
| 2019 | $7,138 +4.5% | $398,300 +6.2% |
| 2018 | $6,831 +3.8% | $374,900 +5.3% |
| 2017 | $6,579 +3.8% | $356,000 +3.9% |
| 2016 | $6,337 +0.3% | $342,700 +3.2% |
| 2015 | $6,320 +5.7% | $332,100 +1.9% |
| 2014 | $5,977 +4.3% | $325,900 |
| 2013 | $5,729 +7% | $325,900 -3.8% |
| 2012 | $5,355 +12% | $338,700 +5.3% |
| 2011 | $4,782 +6.9% | $321,600 +3.5% |
| 2010 | $4,472 +17.4% | $310,800 -12.7% |
| 2009 | $3,808 -6.5% | $355,900 -8.2% |
| 2008 | $4,072 +1.3% | $387,800 -5.6% |
| 2007 | $4,019 +5.6% | $410,900 +4.9% |
| 2006 | $3,807 -8.2% | $391,700 +8.4% |
| 2005 | $4,145 +1.6% | $361,400 +17.7% |
| 2004 | $4,080 +1.9% | $307,000 |
| 2003 | $4,003 +8.8% | $307,000 +48.8% |
| 2002 | $3,680 +13.9% | $206,300 +13.4% |
| 1999 | $3,232 | $181,900 |
Find assessor info on the county website
Monthly payment
Est. payment
Payment breakdown
Explore the cost of this home by adjusting the details. Changes won't be saved.Climate risks
Neighborhood: 02370
Similar homes
- $689,9004 bd2 ba1.6k sqft480 Forest St, Rockland, MA 02370For Sale
 MLS ID #73594028, Brenna Crowe, Real Broker MA, LLC. MLS PIN
- $699,0006 bd2 ba2.4k sqft66-68 Reed St, Rockland, MA 02370For Sale
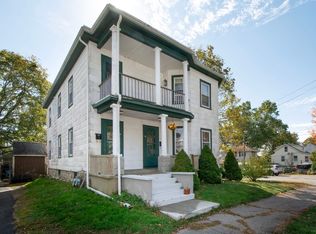 MLS ID #73591783, Ann Marie Baker, William Raveis R.E. & Home Services. MLS PIN
- $869,0008 bd2 ba3.3k sqft239 Howard St, Rockland, MA 02370For Sale
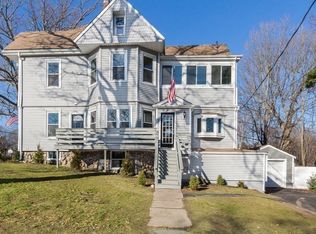 MLS ID #73591283, Markese Daise, Stony Brook & Lennox Realty Advisors. MLS PIN
- $729,0005 bd2 ba2.9k sqft83 Union St, Rockland, MA 02370For Sale
 MLS ID #73590968, Kristen Keating, Real Broker MA, LLC. MLS PIN
- $499,0006 bd2 ba2.5k sqft84-86 Church St, Rockland, MA 02370For Sale
 MLS ID #1426465, Elaine Reavey, Keller Williams Coastal. StateWide MLS RI
