3 Bedroom home, 1 full bath, and full basement. In need of repairs. This is a short sale, and will need approval from the bank. Short Sale fee is due at closing from buyer. As is.
Pending
$145,000
11 Winsten St, Brockton, MA 02301
3beds
864sqft
Single Family Residence
Built in 1957
7,405 Square Feet Lot
$447,100 Zestimate®
$168/sqft
$-- HOA
What's special
- 101 days
- 30
- 4
Zillow last checked:
Listing updated:
Listed by:
Lamya Forghany 978-258-0384,
Lamya A. Forghany 978-258-0384,
Lamya Forghany 978-258-0384
Source: MLS PIN,MLS#: 72006894
Facts & features
Interior
Bedrooms & bathrooms
- Bedrooms: 3
- Bathrooms: 1
- Full bathrooms: 1
Primary bathroom
- Features: No
Heating
- Oil
Cooling
- None
Features
- Basement: Full
- Has fireplace: No
Interior area
- Total structure area: 864
- Total interior livable area: 864 sqft
Property
Parking
- Total spaces: 3
- Uncovered spaces: 3
Lot
- Size: 7,405 Square Feet
- Features: Wooded
Details
- Parcel number: 962983
- Zoning: Res
Construction
Type & style
- Home type: SingleFamily
- Architectural style: Ranch
- Property subtype: Single Family Residence
Materials
- Foundation: Concrete Perimeter
Condition
- Year built: 1957
Utilities & green energy
- Sewer: Public Sewer
- Water: Public
Community & HOA
HOA
- Has HOA: No
Location
- Region: Brockton
Financial & listing details
- Price per square foot: $168/sqft
- Tax assessed value: $159,400
- Annual tax amount: $2,406
- Date on market: 7/14/2026
Estimated market value
$447,100
$416,000 - $474,000
$2,769/mo
Price history
| Date | Event | Price |
|---|---|---|
| 9/23/2026 | Pending sale | $145,000-30%$168/sqft |
Source: MLS PIN #72006894 Report a problem | ||
| 1/30/2020 | Sold | $207,000+16%$240/sqft |
Source: Public Record Report a problem | ||
| 12/26/2019 | Sold | $178,500-2.7%$207/sqft |
Source: Public Record Report a problem | ||
| 12/2/2019 | Pending sale | $183,400$212/sqft |
Source: eXp Realty #72593162 Report a problem | ||
| 11/15/2019 | Listed for sale | $183,400-8.3%$212/sqft |
Source: eXp Realty #72593162 Report a problem | ||
| 11/27/2018 | Listing removed | $199,900$231/sqft |
Source: RE/MAX Synergy #72416570 Report a problem | ||
| 10/27/2018 | Listed for sale | $199,900+37.9%$231/sqft |
Source: RE/MAX Synergy #72416570 Report a problem | ||
| 9/30/2016 | Listing removed | $145,000$168/sqft |
Source: Lamya A. Forghany #72006894 Report a problem | ||
| 9/23/2016 | Pending sale | $145,000$168/sqft |
Source: Lamya A. Forghany #72006894 Report a problem | ||
| 9/23/2016 | Listed for sale | $145,000+2.1%$168/sqft |
Source: Lamya A. Forghany #72006894 Report a problem | ||
| 12/8/2012 | Listing removed | $142,000$164/sqft |
Source: Torres Realty, LLC #71436179 Report a problem | ||
| 9/18/2012 | Price change | $142,000+29.2%$164/sqft |
Source: Torres Realty, LLC #71436179 Report a problem | ||
| 11/10/2011 | Price change | $109,900-8.4%$127/sqft |
Source: RE/MAX Landmark, Realtors #71294755 Report a problem | ||
| 10/1/2011 | Listed for sale | $120,000+9.1%$139/sqft |
Source: RE/MAX Landmark, Realtors #71294755 Report a problem | ||
| 8/4/2011 | Listing removed | $110,000$127/sqft |
Source: RE/MAX Landmark, Realtors #71184383 Report a problem | ||
| 7/25/2011 | Price change | $110,000-8.3%$127/sqft |
Source: RE/MAX Landmark, Realtors #71184383 Report a problem | ||
| 7/8/2011 | Price change | $120,000-14.3%$139/sqft |
Source: RE/MAX Landmark, Realtors #71184383 Report a problem | ||
| 2/4/2011 | Listed for sale | $140,000-42.9%$162/sqft |
Source: Sally Koss #71184383 Report a problem | ||
| 6/1/2004 | Sold | $245,000+36.2%$284/sqft |
Source: Public Record Report a problem | ||
| 7/18/2002 | Sold | $179,900+59.9%$208/sqft |
Source: Public Record Report a problem | ||
| 5/23/1988 | Sold | $112,500$130/sqft |
Source: Public Record Report a problem | ||
Public tax history
| Year | Property taxes | Tax assessment |
|---|---|---|
| 2025 | $4,381 +2.4% | $361,800 +1.6% |
| 2024 | $4,280 +3.4% | $356,100 +11.7% |
| 2023 | $4,139 +4.4% | $318,900 +12.4% |
| 2022 | $3,965 +8.3% | $283,800 +12.4% |
| 2021 | $3,660 +0.4% | $252,400 +4.9% |
| 2020 | $3,645 +6.1% | $240,600 +8.9% |
| 2019 | $3,434 +4.7% | $221,000 +8.2% |
| 2018 | $3,281 +18.1% | $204,300 +18.4% |
| 2017 | $2,779 +0.4% | $172,600 +8.3% |
| 2016 | $2,767 +11.8% | $159,400 +16.9% |
| 2015 | $2,474 +0.9% | $136,300 +0.8% |
| 2014 | $2,451 +12% | $135,200 +4.2% |
| 2013 | $2,189 +2.5% | $129,700 -2% |
| 2012 | $2,135 +15.3% | $132,300 +9.2% |
| 2011 | $1,852 -19.8% | $121,100 -27.7% |
| 2010 | $2,308 +3.5% | $167,600 -16.6% |
| 2009 | $2,231 +8.6% | $201,000 -6.1% |
| 2008 | $2,055 -8.2% | $214,100 -10.2% |
| 2007 | $2,239 -2% | $238,400 -0.5% |
| 2006 | $2,285 +2.3% | $239,500 +13.8% |
| 2005 | $2,234 +6.6% | $210,400 +15.6% |
| 2004 | $2,095 +0.1% | $182,000 +9.9% |
| 2003 | $2,093 +10.4% | $165,600 +21.6% |
| 2002 | $1,895 +25.3% | $136,200 +62.7% |
| 2000 | $1,512 | $83,700 |
Find assessor info on the county website
Monthly payment
Est. payment
Payment breakdown
Explore the cost of this home by adjusting the details. Changes won't be saved.Climate risks
Neighborhood: 02301

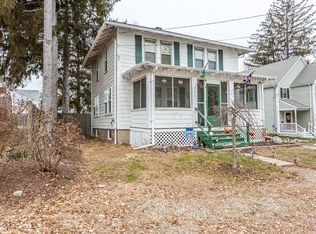
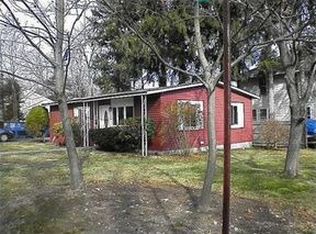
Similar homes
- $174,9001 bd1 ba660 sqft97-103 Colonel Bell Condominium Trust, Brockton, MA 02301For Sale
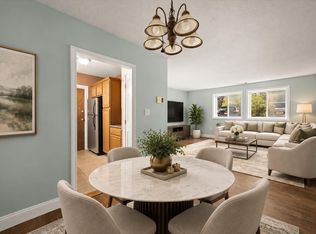 MLS ID #73577749, Colleen & Company Team, Keller Williams Realty. MLS PIN
- $210,0002 bd1 ba603 sqftWestfield Estates, Brockton, MA 02301For Sale
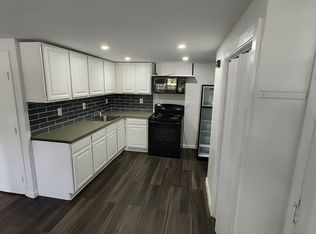 MLS ID #73563040, Mohammad Parwaz, eXp Realty LLC. MLS PIN
- $199,900-- bd-- ba1k sqft138 Perkins Ave, Brockton, MA 02302For Sale
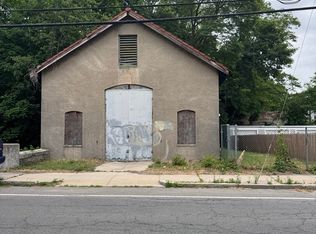 MLS ID #73538438, Butch Wilson, Trufant Real Estate. MLS PIN
- $199,9001 bd1 ba777 sqftThe Times Building, Brockton, MA 02301For Sale
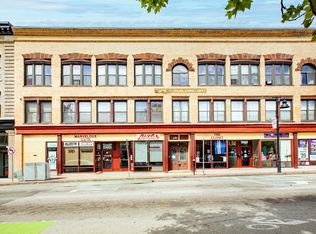 MLS ID #73554860, Christina L. Martinez, Real Broker MA, LLC. MLS PIN
