Beautiful . 48 level lot - a great set-up for the inground pool and lots of room to play, garden, add a garage and/or expand. The house is cute and awaits your touches to bring it back to its glory. Easy to show.
For sale
$679,000
110 Cinderella Terrace, Marstons Mills, MA 02648
3beds
1,152sqft
Single Family Residence
Built in 1982
0.48 Acres Lot
$661,400 Zestimate®
$589/sqft
$-- HOA
What's special
- 11 days
- 700
- 39
Zillow last checked:
Listing updated:
Listed by:
Beth Talerman 774-238-6002,
Murphy Real Estate
Source: CCIMLS,MLS#: 22605520
Facts & features
Interior
Bedrooms & bathrooms
- Bedrooms: 3
- Bathrooms: 2
- Full bathrooms: 2
Heating
- Natural Gas, Electric
Cooling
- None
Appliances
- Included: Refrigerator, Wall/Oven Cook Top, Washer, Electric, Natural Gas, Water Heater
- Laundry: Electric Dryer, Electric Dryer Hookup, Washer Hookup
Features
- Linen Closet
- Flooring: Hardwood, Vinyl, Laminate, Carpet
- Basement: Full
Interior area
- Total structure area: 1,152
- Total interior livable area: 1,152 sqft
Property
Parking
- Parking features: Driveway
- Has uncovered spaces: Yes
Features
- Stories: 2
- Patio & porch: Deck
- Exterior features: Outdoor Shower
- Has private pool: Yes
Lot
- Size: 0.48 Acres
- Features: Fenced/Enclosed, Level
Details
- Additional structures: Outbuilding
- Parcel number: MMIL M:0047 B:0115 L:0000
- Special conditions: Estate Sale
Construction
Type & style
- Home type: SingleFamily
- Property subtype: Single Family Residence
Materials
- Clapboard, Shingle Siding
- Roof: Asphalt,Pitched
Condition
- Year built: 1982
Utilities & green energy
- Water: Public
Community & HOA
Location
- Region: Marstons Mills
Financial & listing details
- Price per square foot: $589/sqft
- Tax assessed value: $479,100
- Annual tax amount: $3,258
- Date on market: 10/31/2026
- Cumulative days on market: 13 days
Estimated market value
$661,400
$628,000 - $694,000
$3,197/mo
Price history
| Date | Event | Price |
|---|---|---|
| 10/31/2026 | Listed for sale | $679,000+618.5%$589/sqft |
Source:  CCIMLS #22605520 Report a problem | ||
| 6/15/1986 | Sold | $94,500$82/sqft |
Source: Agent Provided Report a problem | ||
Public tax history
| Year | Property taxes | Tax assessment |
|---|---|---|
| 2025 | $3,759 +6.7% | $464,600 +3% |
| 2024 | $3,524 +4.4% | $451,200 +11.4% |
| 2023 | $3,377 +6.2% | $404,900 +22.7% |
| 2022 | $3,181 +1.6% | $330,000 +10.5% |
| 2021 | $3,132 -2.8% | $298,600 +1.5% |
| 2020 | $3,223 +5.1% | $294,100 +8.2% |
| 2019 | $3,067 +6% | $271,900 +5.5% |
| 2018 | $2,893 +6.8% | $257,800 +2.3% |
| 2017 | $2,710 -1.7% | $251,900 -0.4% |
| 2016 | $2,758 +2.9% | $253,000 +2.4% |
| 2015 | $2,680 +1.9% | $247,000 -0.2% |
| 2014 | $2,631 +3.5% | $247,500 -0.2% |
| 2013 | $2,541 +13.1% | $248,100 +8.8% |
| 2012 | $2,247 +3.8% | $228,100 -1.1% |
| 2011 | $2,164 +2.8% | $230,700 -1% |
| 2010 | $2,105 -3.7% | $233,100 -14.9% |
| 2009 | $2,185 +0.9% | $273,800 -3.8% |
| 2008 | $2,165 +20.6% | $284,500 +0.2% |
| 2007 | $1,795 -0.7% | $284,000 -0.9% |
| 2006 | $1,808 +22.4% | $286,500 +17.4% |
| 2005 | $1,477 -1.2% | $244,100 +83.3% |
| 2004 | $1,495 | $133,200 |
| 2003 | $1,495 +24.9% | $133,200 |
| 2001 | $1,197 +10.5% | $133,200 +57.4% |
| 2000 | $1,083 | $84,600 |
Find assessor info on the county website
Monthly payment
Est. payment
Payment breakdown
Explore the cost of this home by adjusting the details. Changes won't be saved.Climate risks
Neighborhood: Marstons Mills
- $626,2003 bd2 ba1.7k sqft96 Cinderella Ter, Marstons Mills, MA 02648Off Market
- $657,3004 bd2 ba1.5k sqft124 Cinderella Ter, Marstons Mills, MA 02648Off Market
- $601,7003 bd2 ba1.4k sqft117 Cinderella Ter, Marstons Mills, MA 02648Off Market
- $583,0004 bd2 ba1.3k sqft97 Cinderella Ter, Marstons Mills, MA 02648Off Market
Similar homes
- $635,0003 bd2 ba1.2k sqft44 Millrace Road, Marstons Mills, MA 02648For Sale
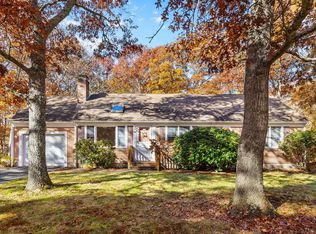
 MLS ID #22605599, Becky A Kanaley, Compass. CCIMLS
- $669,0003 bd2 ba1.7k sqft109 Blueberry Lane, Marstons Mills, MA 02648For Sale
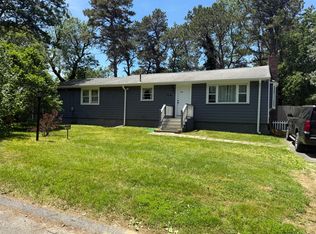 MLS ID #22602674, Mario A Neno, Mega Realty Services, Inc.. CCIMLS
- $750,0003 bd3 ba1.6k sqft34 Commodore Lane, Marstons Mills, MA 02648For Sale
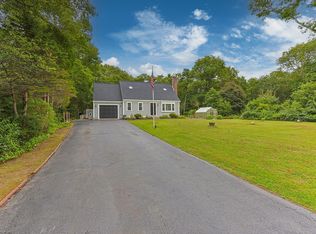 MLS ID #22604232, Tiffany Callahan, Greer Real Estate, LLC. CCIMLS
- $650,0003 bd2 ba1.5k sqft90 Captain Lijahs Rd, Barnstable, MA 02632For Sale
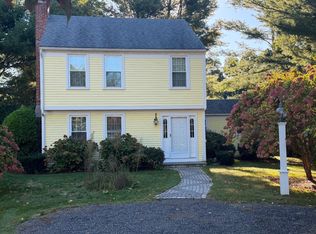 MLS ID #73589483, Nicole DeFrancesco, Silverstone Capeside Realty Group. MLS PIN
- $619,0003 bd3 ba1.1k sqft37 Huckleberry Lane, Marstons Mills, MA 02648For SaleMLS ID #22603720, Maiza F Eloy, Today Real Estate. CCIMLS
- $695,0003 bd2 ba1.6k sqft82 Hawser Bend, Centerville, MA 02632For SaleMLS ID #22605387, Carole B Swartz, Kinlin Grover Compass. CCIMLS
- $650,0003 bd2 ba1.6k sqft16 Pine View Drive, Cotuit, MA 02635For SaleMLS ID #22603078, Corinne J Costanzo, Berkshire Hathaway HomeServices Robert Paul Properties. CCIMLS
- $589,9002 bd2 ba1.3k sqft29 Race Lane, Sandwich, MA 02563For SaleMLS ID #22604379, Erin Cameron, William Raveis Real Estate & Home Services. CCIMLS
- $722,0003 bd2 ba1.2k sqft248 Poponessett Rd Road, Cotuit, MA 02635For SaleMLS ID #22604681, John M Westlund, Coldwell Banker Realty. CCIMLS
- $724,0003 bd2 ba1.4k sqft114 King Arthur Drive, Osterville, MA 02655For SaleMLS ID #22602806, Christine L Case, C. Case Realty, LLC. CCIMLS
- $795,0003 bd2 ba1.3k sqft35 Pequot Road, Mashpee, MA 02649For SaleMLS ID #22604858, Brian G Cobb, CRS, Kinlin Grover Compass. CCIMLS
- $629,9002 bd2 ba1k sqft55 Seth Goodspeed Way, Osterville, MA 02655For SaleMLS ID #22601981, Donna Christopher, Sotheby's International Realty. CCIMLS
- $739,0003 bd2 ba1.6k sqft744 Old Barnstable Road, Mashpee, MA 02649For SaleMLS ID #22602572, Robert B Dugan, Harriet Dugan Realty. CCIMLS
- $759,0004 bd2 ba1.4k sqft236 Poponessett Road, Cotuit, MA 02635For SaleMLS ID #22604980, Paul E Grover, Berkshire Hathaway HomeServices Robert Paul Properties. CCIMLS
