Spacious brick home offering 3,000+ sq ft with 4 bedrooms on the main level plus a large bonus room and 5th bedroom upstairs. Recently remodeled with fresh paint, new flooring and an abundance of vinyl windows providing lots of natural light. Large closets throughout. Roof is less than 2 years old, central unit approx. 5 years old, plus a new electrical panel. Situated on a beautiful shaded corner lot just over half an acre! Storage room, building, and walk in attic provide plenty of extra space!
Active
$229,000
110 Fonville St, Sharon, TN 38255
5beds
2baths
3,064sqft
Single Family Residence
Built in 1929
0.63 Acres Lot
$221,600 Zestimate®
$75/sqft
$-- HOA
What's special
Spacious brick homeRecently remodeledFresh paintStorage roomLarge bonus roomNew flooringLarge closets throughout
- 33 days
- 315
- 19
Zillow last checked:
Listing updated:
Listed by:
JENNIFER HAMLIN 731-695-8014,
HAMLIN REAL ESTATE 731-456-2508
Source: RRAR as distributed by MLS GRID,MLS#: 46716
Facts & features
Interior
Bedrooms & bathrooms
- Bedrooms: 5
- Bathrooms: 2
Heating
- Has Heating (Unspecified Type)
Cooling
- Central Air
Appliances
- Included: Dishwasher
Features
- Flooring: Carpet, Hardwood, Laminate
Interior area
- Total interior livable area: 3,064 sqft
Property
Parking
- Total spaces: 2
- Parking features: Garage
- Garage spaces: 2
Features
- Stories: 2
Lot
- Size: 0.63 Acres
- Features: Corner Lot
Details
- Parcel number: 002.00
Construction
Type & style
- Home type: SingleFamily
- Property subtype: Single Family Residence
Materials
- Brick
- Foundation: Crawl Space
Condition
- Year built: 1929
Utilities & green energy
- Sewer: Public Sewer
- Water: Public
Community & HOA
Location
- Region: Sharon
Financial & listing details
- Price per square foot: $75/sqft
- Tax assessed value: $155,200
- Annual tax amount: $1,130
- Date on market: 10/7/2026
Estimated market value
$221,600
$211,000 - $233,000
$1,793/mo
Price history
| Date | Event | Price |
|---|---|---|
| 10/7/2026 | Listed for sale | $229,000+143.6%$75/sqft |
Source: RRAR as distributed by MLS GRID #46716 Report a problem | ||
| 6/20/2025 | Sold | $94,000-21.7%$31/sqft |
Source: Public Record Report a problem | ||
| 2/22/2023 | Listing removed | -- |
Source: Owner Report a problem | ||
| 11/23/2022 | Listed for sale | $120,000+41.3%$39/sqft |
Source: Owner Report a problem | ||
| 6/25/2017 | Listing removed | $84,900$28/sqft |
Source: RE/MAX United #39204 Report a problem | ||
| 6/20/2017 | Listed for sale | $84,900+8.8%$28/sqft |
Source: RE/MAX UNITED, LLC #39204 Report a problem | ||
| 5/8/2017 | Listing removed | $78,000$25/sqft |
Source: Owner Report a problem | ||
| 11/8/2016 | Listed for sale | $78,000-2.5%$25/sqft |
Source: Owner Report a problem | ||
| 5/10/2016 | Listed for sale | $80,000+77.8%$26/sqft |
Source: Owner Report a problem | ||
| 10/19/2001 | Sold | $45,000$15/sqft |
Source: Public Record Report a problem | ||
Public tax history
| Year | Property taxes | Tax assessment |
|---|---|---|
| 2025 | $1,130 +9% | $38,800 |
| 2024 | $1,037 | $38,800 |
| 2023 | $1,037 +11% | $38,800 +64.9% |
| 2022 | $935 +5.3% | $23,525 |
| 2021 | $888 | $23,525 |
| 2020 | $888 | $23,525 |
| 2019 | $888 | $23,525 |
| 2018 | $888 -1.7% | $23,525 +1.5% |
| 2017 | $903 +2.7% | $23,175 |
| 2016 | $879 | $23,175 +0% |
| 2015 | $879 | $23,168 |
| 2014 | $879 | $23,168 |
| 2013 | $879 -0.1% | $23,168 |
| 2012 | $880 +2.5% | $23,168 -0.4% |
| 2011 | $859 -1.3% | $23,268 -1.3% |
| 2010 | $870 | $23,571 |
| 2009 | $870 -0.1% | $23,571 |
| 2008 | $871 -12.9% | $23,571 |
| 2007 | $999 +19.3% | $23,571 +13.7% |
| 2006 | $838 +2.5% | $20,736 |
| 2005 | $817 | $20,736 |
| 2004 | $817 +0.3% | $20,736 |
| 2002 | $815 | $20,736 |
| 2001 | -- | $20,736 -72.3% |
| 2000 | -- | $74,970 |
Find assessor info on the county website
Monthly payment
Est. payment
Payment breakdown
Explore the cost of this home by adjusting the details. Changes won't be saved.Climate risks
Neighborhood: 38255

Similar homes
- $265,0003 bd2 ba2.1k sqft1407 Sharon Rd, Sharon, TN 38255For Sale
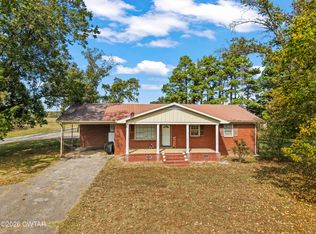 MLS ID #2604887, Braden Mileham, Blue Suede Realty. CWTAR
- $197,0003 bd2 ba1.7k sqft6433 Greenfield Hwy #54, Dresden, TN 38225For Sale
 MLS ID #46780, JENNIFER HAMLIN, HAMLIN REAL ESTATE. RRAR as distributed by MLS GRID
- $239,0003 bd2 ba1.9k sqft221 Laura St, Martin, TN 38237For Sale
 MLS ID #46767, JENNIFER HAMLIN, HAMLIN REAL ESTATE. RRAR as distributed by MLS GRID
- $--3 bd2 ba1.5k sqft212 K St, Martin, TN 38237Auction
 Auction.com 2
- $239,9003 bd3 ba1.7k sqft110 Laura St, Martin, TN 38237For Sale
 MLS ID #3542448, Sonya Harris. RealTracs MLS as distributed by MLS GRID
