This home was completely rebuilt after a fire in 2009.
Pre-foreclosure
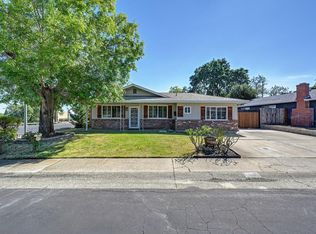
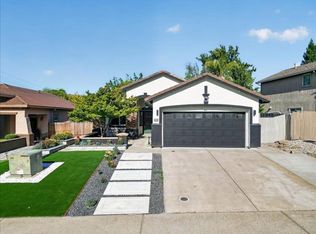
Street View
Est. $647,100
111 Seergreen Way, Folsom, CA 95630
3beds
2,158sqft
SingleFamily
Built in 1988
6,272 Square Feet Lot
$647,100 Zestimate®
$300/sqft
$-- HOA
Overview
- 57 days |
- 27 |
- 1 |
Facts & features
Interior
Bedrooms & bathrooms
- Bedrooms: 3
- Bathrooms: 3
- Full bathrooms: 2
- 1/2 bathrooms: 1
Heating
- Other, Electric, Gas
Cooling
- Central
Appliances
- Included: Dishwasher, Dryer, Freezer, Garbage disposal, Microwave, Range / Oven, Refrigerator, Washer
Features
- Flooring: Tile, Carpet
- Has fireplace: Yes
Interior area
- Total interior livable area: 2,158 sqft
Property
Parking
- Total spaces: 2
- Parking features: Garage - Attached
Features
- Exterior features: Cement / Concrete
Lot
- Size: 6,272 Square Feet
Details
- Parcel number: 07107900620000
Construction
Type & style
- Home type: SingleFamily
Materials
- wood frame
- Roof: Composition
Condition
- Year built: 1988
Community & HOA
Location
- Region: Folsom
Financial & listing details
- Price per square foot: $300/sqft
- Tax assessed value: $300,381
- Annual tax amount: $3,533
Visit our professional directory to find a foreclosure specialist in your area that can help with your home search.
Find a foreclosure agentForeclosure details
Estimated market value
$647,100
$608,000 - $686,000
$3,050/mo
Price history
Price history is unavailable.
Public tax history
| Year | Property taxes | Tax assessment |
|---|---|---|
| 2025 | $3,533 +2% | $300,381 +2% |
| 2024 | $3,462 +9.9% | $294,492 +2% |
| 2023 | $3,150 | $288,719 +2% |
| 2022 | -- | $283,058 +2% |
| 2021 | $3,419 +1.1% | $277,509 +1% |
| 2020 | $3,382 +1.5% | $274,665 +2% |
| 2019 | $3,331 +2.5% | $269,281 +2% |
| 2018 | $3,249 +6.7% | $264,002 +2% |
| 2017 | $3,045 -3.7% | $258,827 +2% |
| 2016 | $3,162 +3.2% | $253,753 +1.5% |
| 2015 | $3,062 +4.8% | $249,942 +2% |
| 2014 | $2,921 | $245,047 +0.5% |
| 2013 | -- | $243,940 +2% |
| 2012 | -- | $239,158 +2% |
| 2011 | -- | $234,469 +0.8% |
| 2010 | -- | $232,718 -34% |
| 2008 | -- | $352,511 +2% |
| 2007 | -- | $345,600 +57.2% |
| 2006 | -- | $219,821 +2% |
| 2005 | -- | $215,512 +2% |
| 2004 | -- | $211,288 +1.9% |
| 2003 | -- | $207,417 +2% |
| 2002 | -- | $203,351 +2% |
| 2001 | -- | $199,365 +2% |
| 2000 | -- | $195,457 |
Find assessor info on the county website
Monthly payment
Estimated monthly payment$1,822
All calculations are estimates and provided by Zillow, Inc. for informational purposes only. Actual amounts may vary.
HOA fees may include property taxes on listings classified as Co-Ops. Contact the listing agent and/or owner for fee details.
Mortgage interest rates are dependent on a number of factors, including credit score, down payment, and repayment length. Interest rate data provided by Zillow Group Marketplace, Inc. as of 1/1/1970 from various mortgage lenders with which we have lead or other similar arrangements; the Estimated Payment is an average of those rates.
See how much you could borrow to make a competitive offer.
Climate risks
Neighborhood: Central District
Nearby schools
GreatSchools rating
- 9/10Theodore Judah Elementary SchoolGrades: K-5Distance: 1 mi
- 8/10Sutter Middle SchoolGrades: 6-8Distance: 0.9 mi
- 10/10Folsom High SchoolGrades: 9-12Distance: 1.1 mi


- California
- Sacramento County
- Folsom
- 95630
- Central District
- 111 Seergreen Way
Nearby cities
Nearby neighborhoods
Nearby zip codes
Other Folsom Topics
