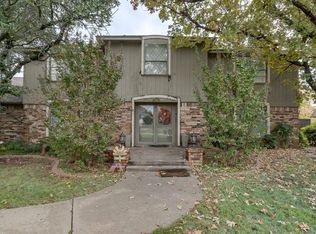
Beautiful house with a tree house and a 550 square feet bonus room with its own full bathroom and small kitchen area. The has 4 bedrooms and 3 bathrooms, not including the bonus room. The house includes a formal and family living room, a dinnering room, and breakfast room for all types of parties and family events. The kitchen comes with granite countertops, fridge/freezer, microwave, double oven, and gas stove. The large backyard has a patio area and a deck area with a tree house that over looks backyard. The attached garage can have 3 cars parked inside.
For sale by owner
Price cut: $30K (11/18)
$395,000
11113 Woodbridge Rd, Oklahoma City, OK 73162
4beds
2,743sqft
SingleFamily
Built in 1992
0.41 Acres Lot
$-- Zestimate®
$144/sqft
$-- HOA
What's special
Patio areaDeck areaLarge backyardGas stoveGranite countertopsTree houseBreakfast room
- 22 days
- 694
- 68
Listed by:
Property Owner (405) 323-1351
Facts & features
Interior
Bedrooms & bathrooms
- Bedrooms: 4
- Bathrooms: 3
- Full bathrooms: 3
Heating
- Forced air, Gas
Cooling
- Central
Appliances
- Included: Dishwasher, Garbage disposal, Microwave, Range / Oven, Refrigerator
Features
- Flooring: Tile, Hardwood
- Basement: None
- Has fireplace: Yes
Interior area
- Total interior livable area: 2,743 sqft
Property
Parking
- Parking features: Garage - Attached
Features
- Exterior features: Brick
Lot
- Size: 0.41 Acres
Details
- Parcel number: 3882122761420
Construction
Type & style
- Home type: SingleFamily
Materials
- Frame
- Foundation: Slab
- Roof: Composition
Condition
- New construction: No
- Year built: 1992
Community & HOA
Location
- Region: Oklahoma City
Financial & listing details
- Price per square foot: $144/sqft
- Tax assessed value: $316,830
- Annual tax amount: $4,169
- Date on market: 10/28/2026
Estimated market value
Not available
Estimated sales range
Not available
$2,671/mo
Price history
| Date | Event | Price |
|---|---|---|
| 11/18/2026 | Price change | $395,000-7.1%$144/sqft |
Source: Owner Report a problem | ||
| 10/28/2026 | Listed for sale | $425,000+105.3%$155/sqft |
Source: Owner Report a problem | ||
| 3/6/2015 | Sold | $207,000-31%$75/sqft |
Source: Public Record Report a problem | ||
| 11/3/2008 | Sold | $300,000-4.7%$109/sqft |
Source:  MLSOK/OKCMAR as distributed by MLS GRID #363933 Report a problem | ||
| 8/22/2008 | Listed for sale | $314,900$115/sqft |
Source: Listhub #363933 Report a problem | ||
Public tax history
| Year | Property taxes | Tax assessment |
|---|---|---|
| 2025 | $4,169 +3.8% | $34,851 +3% |
| 2024 | $4,016 +3.4% | $33,835 +3% |
| 2023 | $3,883 +1.8% | $32,849 +3% |
| 2022 | $3,813 +4.1% | $31,893 +3% |
| 2021 | $3,663 +2.5% | $30,965 +2% |
| 2020 | $3,573 +32.7% | $30,360 +2.2% |
| 2019 | $2,693 +1.8% | $29,700 +1.7% |
| 2018 | $2,646 -23% | $29,205 -1.3% |
| 2017 | $3,438 | $29,589 +2.3% |
| 2016 | $3,438 +2.6% | $28,929 -8.9% |
| 2015 | $3,352 -5.2% | $31,764 +5% |
| 2014 | $3,535 | $30,251 +5% |
| 2013 | -- | $28,811 -1.7% |
| 2012 | -- | $29,306 +0.8% |
| 2011 | -- | $29,072 +2.4% |
| 2010 | -- | $28,402 -6.2% |
| 2009 | -- | $30,276 -2.5% |
| 2008 | -- | $31,037 +5% |
| 2007 | -- | $29,562 +5% |
| 2006 | -- | $28,155 +0.2% |
| 2005 | -- | $28,101 -88.5% |
| 2004 | $2,811 | $243,309 +809.1% |
| 2003 | -- | $26,763 +10.2% |
| 2002 | -- | $24,276 |
| 2001 | -- | $24,276 |
| 2000 | -- | $24,276 +8.3% |
| 1999 | -- | $22,420 |
Find assessor info on the county website
Monthly payment
Est. payment
Payment breakdown
Explore the cost of this home by adjusting the details. Changes won't be saved.Climate risks
Neighborhood: 73162
- $498,6004 bd4 ba3.8k sqft11117 Woodbridge Rd, Oklahoma City, OK 73162Off Market
- $592,8004 bd4 ba3.8k sqft11109 Woodbridge Rd, Oklahoma City, OK 73162Off Market
- $494,9005 bd3 ba4.3k sqft11216 Kingswick Dr, Oklahoma City, OK 73162Off Market
- $413,0004 bd3 ba3.6k sqft11201 Woodbridge Rd, Oklahoma City, OK 73162Off Market
Similar homes
- $400,0005 bd4 ba3.6k sqft6000 Kingsbridge Dr, Oklahoma City, OK 73162For Sale
 MLS ID #1258709, Casey Tuter, Brix Realty. MLSOK/OKCMAR as distributed by MLS GRID
- $415,0004 bd3 ba2.9k sqft6108 Plum Thicket Rd, Oklahoma City, OK 73162For Sale
 MLS ID #1251991, Anne Wilson, Keller Williams Central OK. MLSOK/OKCMAR as distributed by MLS GRID
- $374,9004 bd3 ba2.6k sqft11409 Pinewick Dr, Oklahoma City, OK 73162For Sale
 MLS ID #1238629, James Brollier, eXp Realty, LLC. MLSOK/OKCMAR as distributed by MLS GRID
- $369,0004 bd3 ba3.3k sqft9721 Lakeland Ter, Oklahoma City, OK 73162For Sale
 MLS ID #1255639, Barrett Huffmyer, Salt Real Estate Inc. MLSOK/OKCMAR as distributed by MLS GRID
