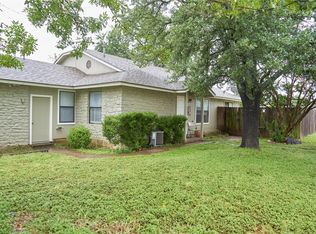
This townhome is located in Pflugerville! "First Look Program" - First Look properties are sold exclusively to buyers who intend to live in the property or Approved Entities. This property is eligible under the Freddie Mac First Look Initiative through 8/2/26. Highest and best offers must be submitted by 10:00AM CDT on 8/11.
Foreclosed
Est. $232,808
1113 Orchard Park Cir, Pflugerville, TX 78660
3beds
1,221sqft
Townhouse
Built in 1985
-- sqft lot
$-- Zestimate®
$191/sqft
$-- HOA
Overview
- 209 days
- 41
- 1
Zillow last checked:
Source: BHHS broker feed,MLS#: 2678771
Facts & features
Interior
Bedrooms & bathrooms
- Bedrooms: 3
- Bathrooms: 3
- Full bathrooms: 2
- 1/2 bathrooms: 1
Heating
- Natural Gas
Cooling
- Central Air
Appliances
- Included: Dryer, Refrigerator
Features
- Has basement: No
Interior area
- Total structure area: 1,221
- Total interior livable area: 1,221 sqft
Property
Details
- Parcel number: 278616
Construction
Type & style
- Home type: Townhouse
- Property subtype: Townhouse
Materials
- Stone
Condition
- Year built: 1985
Community & HOA
Location
- Region: Pflugerville
Financial & listing details
- Price per square foot: $191/sqft
- Tax assessed value: $232,808
- Annual tax amount: $3,409
- Date on market: 7/4/2026
- Lease term: Contact For Details
Foreclosure details
Estimated market value
Not available
Estimated sales range
Not available
$1,749/mo
Price history
| Date | Event | Price |
|---|---|---|
| 11/6/2026 | Sold | -- |
Source: Agent Provided Report a problem | ||
| 8/19/2026 | Pending sale | $149,900$123/sqft |
Source: BHHS broker feed #2678771 Report a problem | ||
| 7/4/2026 | Listed for sale | $149,900-44.5%$123/sqft |
Source: BHHS broker feed #2678771 Report a problem | ||
| 4/15/2026 | Sold | -- |
Source: Public Record Report a problem | ||
| 2/2/2022 | Sold | -- |
Source: Agent Provided Report a problem | ||
| 1/10/2022 | Pending sale | $269,990$221/sqft |
Source:  Unlock MLS #6498076 Report a problem | ||
| 1/5/2022 | Contingent | $269,990$221/sqft |
Source: Unlock MLS #6498076 Report a problem | ||
| 1/2/2022 | Listed for sale | $269,990+206.8%$221/sqft |
Source: Unlock MLS #6498076 Report a problem | ||
| 11/6/2019 | Sold | -- |
Source: Agent Provided Report a problem | ||
| 9/13/2017 | Listing removed | $1,112$1/sqft |
Source: GDAA PROPERTY MANAGEMENT - Property # 385654 Report a problem | ||
| 8/30/2017 | Listed for rent | $1,112-6.9%$1/sqft |
Source: GDAA PROPERTY MANAGEMENT - Property # 385654 Report a problem | ||
| 9/19/2015 | Listing removed | $1,195$1/sqft |
Source: Postlets Report a problem | ||
| 8/29/2015 | Price change | $1,195-4.4%$1/sqft |
Source: Postlets Report a problem | ||
| 8/26/2015 | Listed for rent | $1,250$1/sqft |
Source: Postlets Report a problem | ||
| 5/25/2013 | Listing removed | $88,000$72/sqft |
Source: Capital City Sotheby's Realty #3274359 Report a problem | ||
| 5/10/2013 | Listed for sale | $88,000$72/sqft |
Source: Capital City Sotheby's Realty #3274359 Report a problem | ||
Public tax history
| Year | Property taxes | Tax assessment |
|---|---|---|
| 2025 | $3,409 -27.4% | $232,808 -15.5% |
| 2024 | $4,692 -9.4% | $275,435 -11.4% |
| 2023 | $5,182 -17.3% | $310,974 +11.3% |
| 2022 | $6,266 | $279,394 +47.1% |
| 2021 | -- | $189,986 +26.3% |
| 2020 | $3,750 -1.2% | $150,400 -8% |
| 2019 | $3,794 +9.8% | $163,415 +20.2% |
| 2018 | $3,455 | $135,936 +4.5% |
| 2017 | $3,455 +71.6% | $130,052 +27.8% |
| 2016 | $2,013 | $101,790 +8.8% |
| 2015 | $2,013 | $93,544 +28% |
| 2014 | $2,013 | $73,095 +6.8% |
| 2013 | -- | $68,455 +36.1% |
| 2012 | -- | $50,313 -39.2% |
| 2011 | -- | $82,799 +6.3% |
| 2010 | -- | $77,900 -14.1% |
| 2009 | -- | $90,721 -0.5% |
| 2008 | -- | $91,208 +10.6% |
| 2007 | -- | $82,445 +9.7% |
| 2006 | -- | $75,142 -6.1% |
| 2005 | -- | $80,000 |
Find assessor info on the county website
Monthly payment
Climate risks
Neighborhood: Windermere
- $227,100-- bd2 ba1.1k sqft1111 Orchard Park Cir, Pflugerville, TX 78660Off Market
- $218,200-- bd2 ba1.2k sqft1115 Orchard Park Cir, Pflugerville, TX 78660Off Market
- $226,200-- bd2 ba1.1k sqft1109 Orchard Park Cir, Pflugerville, TX 78660Off Market

- $205,5003 bd3 ba1.2k sqft1117 Orchard Park Cir, Pflugerville, TX 78660Off Market

Similar homes
- $239,0003 bd2 ba1.3k sqft1231 Orchard Park Cir, Pflugerville, TX 78660Active

 MLS ID #1714754, Melissa Meeks Kilian, Kuper Sotheby's Int'l Realty. Unlock MLS
- $220,0003 bd2 ba968 sqft16001 Stoneham Cir, Pflugerville, TX 78660Active
 MLS ID #1792546, Renee Fox, Fox Realty. Unlock MLS
- $220,0003 bd2 ba968 sqft16003 Stoneham Cir, Pflugerville, TX 78660Active
 MLS ID #7763368, Renee Fox, Fox Realty. Unlock MLS
- $199,9993 bd2 ba968 sqft16132 Fitchburg Cir, Pflugerville, TX 78660Active
 MLS ID #5596497, Brett Danaher, Century 21 Stribling Properties. Unlock MLS
- $199,9993 bd2 ba968 sqft16134 Fitchburg Cir, Pflugerville, TX 78660ActiveMLS ID #9366123, Brett Danaher, Century 21 Stribling Properties. Unlock MLS
- $259,9503 bd2 ba1.1k sqft1202 Ivybridge Dr, Pflugerville, TX 78660ActiveMLS ID #1673387, Collin Kendrick, Thrive Realty. Unlock MLS
- $199,9902 bd1 ba897 sqft16100 Windermere Dr, Pflugerville, TX 78660ActiveMLS ID #3693961, Carol Reiss, Fathom Realty. Unlock MLS
- $275,0003 bd3 ba1.7k sqft200 Adage Dr, Pflugerville, TX 78660ActiveMLS ID #3814272, Bobby Baylor, RealAgent. Unlock MLS
- $281,0003 bd2 ba1.1k sqft16312 Edgemere Dr, Pflugerville, TX 78660ActiveMLS ID #8338610, Debbie Luzzo, Carlene Bond, Broker. Unlock MLS
- $259,0003 bd3 ba1.6k sqft405 Rhetoric Way, Pflugerville, TX 78660ActiveMLS ID #8851793, Jim Mayo, Coldwell Banker Realty. Unlock MLS
- $229,9003 bd2 ba1.5k sqft17414 Dashwood Creek Dr, Pflugerville, TX 78660ActiveMLS ID #7033773, Jonathan Lay Layton, Luxely Real Estate. Unlock MLS
- $229,0003 bd1 ba952 sqft200 E Hoopes Ave, Pflugerville, TX 78660Active
 MLS ID #625859, Judy Tidwell, Pure Realty. Central Texas MLS
- $285,0003 bd2 ba1.4k sqft16207 Parkway Dr, Pflugerville, TX 78660ActiveMLS ID #6850792, Amber Broadway, Opendoor Brokerage LLC. Unlock MLS
- $269,0003 bd3 ba1.7k sqft124 Homily Dr, Pflugerville, TX 78660ActiveMLS ID #6211752, Julia Fitch, Compass RE Texas, LLC. Unlock MLS
- $279,0004 bd3 ba1.5k sqft617 Katmai Cir, Pflugerville, TX 78660ActiveMLS ID #1194959, Salman Ashraf, Ashrock Realty. Unlock MLS
- $269,9003 bd3 ba1.3k sqft419 Katmai Cir, Pflugerville, TX 78660ActiveMLS ID #1958831, Dashen Lin, Evergreen Properties. Unlock MLS
- $275,0003 bd2 ba1.2k sqft1519 Miss Allisons Way, Pflugerville, TX 78660ActiveMLS ID #4601305, Julie Hutchison, eXp Realty, LLC. Unlock MLS
- $309,9503 bd2 ba1.2k sqft16506 Colwyn Bay Cv, Pflugerville, TX 78660ActiveMLS ID #2492823, Taylor Goodman, Bramlett Partners. Unlock MLS
- $318,5003 bd2 ba1.1k sqft16308 Parkway Dr, Pflugerville, TX 78660ActiveMLS ID #1122397, Jenny Rosas, Compass RE Texas, LLC. Unlock MLS
